
Crypto Market in the last 24h
🌍 Total crypto market cap: 3.09T USD (−1.22% ↓)
🔄 Total crypto market volume 24h: 112.46B USD (−14.91% ↓)
🧩 DeFi volume 24h: 14.10B USD | 12.53% of total (↓)
🪙 Stablecoins volume 24h: 111.37B USD | 99.03% of total (≈ stable)
🟠 Bitcoin dominance: 58.44% (+0.11% ↑)
Bitcoin (BTC) analysis
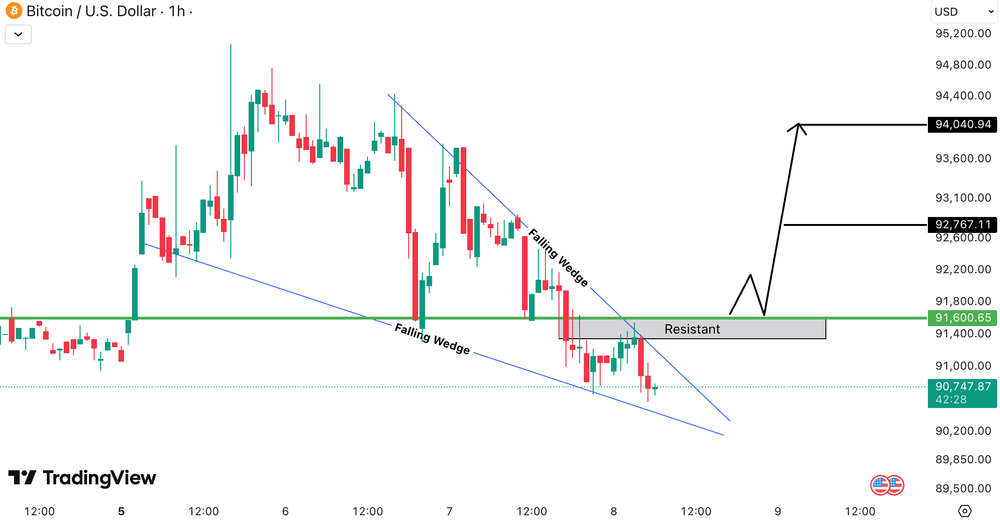
BTCUSD on the 1H timeframe is moving inside a falling wedge, a pattern that typically signals a potential bullish reversal. Price is currently trading below the key resistance zone around 91,600.00 USD (≈ 84,272.00 EUR), making this level critical for confirmation.
A strong breakout and close above resistance could open upside targets toward:
- 92,767.00 USD (≈ 85,345.64 EUR)
- 94,040.00 USD (≈ 86,516.80 EUR)
Until a confirmed breakout occurs, BTCUSD may remain range-bound or see minor downside movement before attempting a reversal.
Ethereum (ETH) analysis
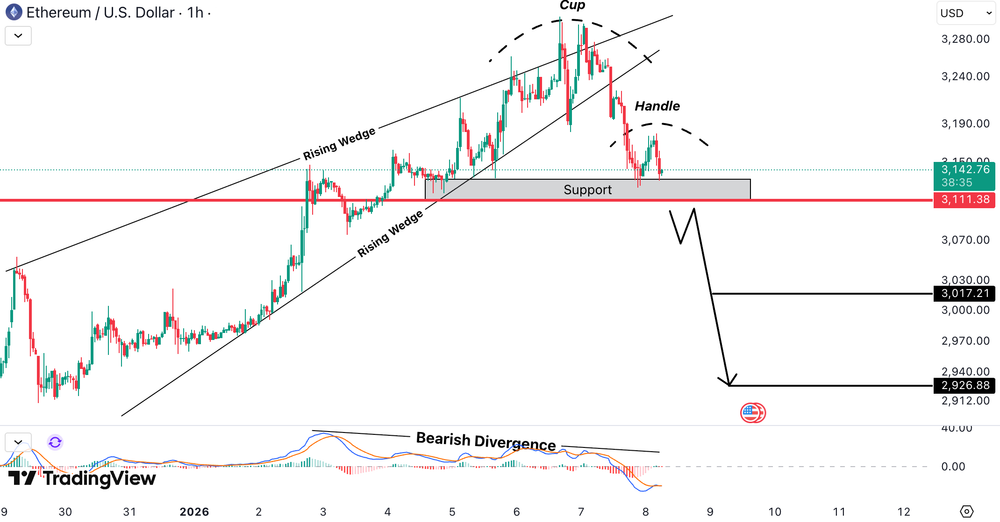
ETHUSD on the 1H timeframe has confirmed a breakdown from a rising wedge, reinforcing the bearish outlook. The presence of an inverse cup & handle, combined with bearish divergence, adds confluence to the downside scenario.
Price is currently testing the key support zone at:
- 3,111.00 USD (≈ 2,862.12 EUR)
A clean breakdown below this level could open the path toward:
- 3,017.00 USD (≈ 2,775.64 EUR)
- 2,926.00 USD (≈ 2,692.00 EUR)
Unless ETHUSD reclaims the broken wedge with strong volume, rallies are likely to face continued selling pressure.
MultiversX (EGLD) analysis
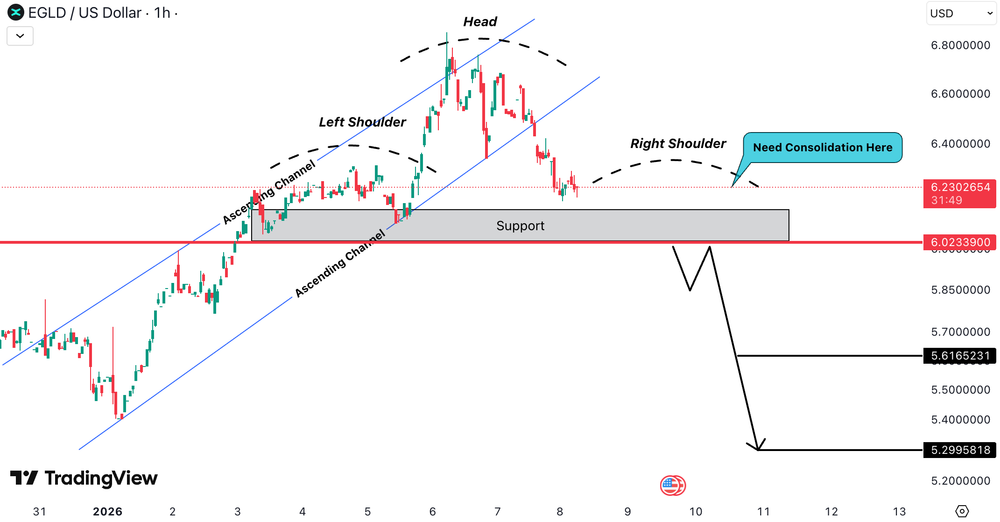
EGLDUSD on the 1H timeframe has broken down from the ascending channel, signaling weakening bullish momentum. The chart is forming a head and shoulders pattern, with the right shoulder still under construction near the support zone.
The key support level to watch is:
- 6.02 USD (≈ 5.54 EUR)
A break and close below this level could open the path toward:
- 5.61 USD (≈ 5.16 EUR) as the first target
- 5.29 USD (≈ 4.87 EUR) as the next downside target
Holding above support may result in short-term consolidation.
Binance Coin (BNB) analysis
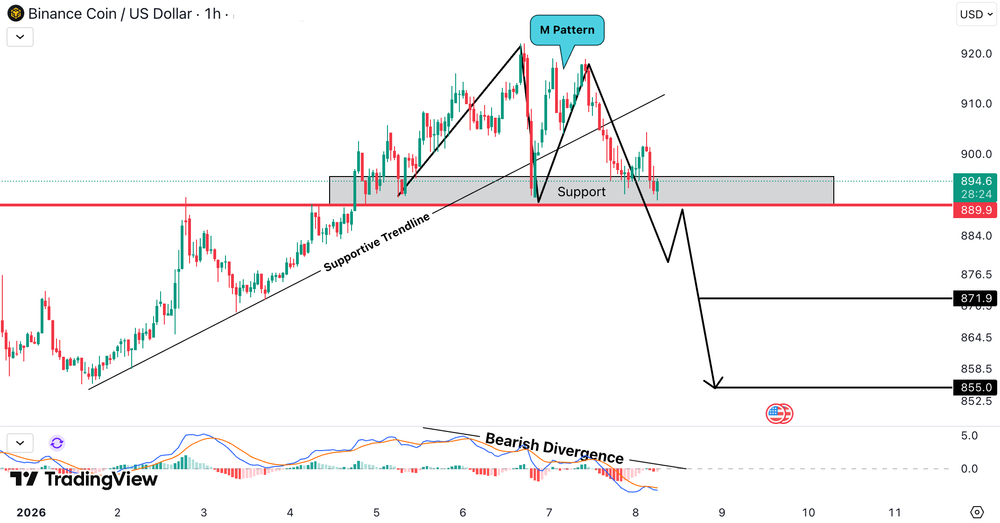
BNBUSD on the 1H timeframe has formed an M pattern near the top, indicating a potential bearish reversal. Price is currently trading around a key support zone at:
- 889.90 USD (≈ 818.71 EUR)
This area aligns with a previous demand zone. Additionally, bearish divergence on momentum indicators strengthens the downside bias.
If BNBUSD breaks and closes below support, further selling pressure could push price toward:
- 871.90 USD (≈ 802.15 EUR)
- 855.00 USD (≈ 786.60 EUR)
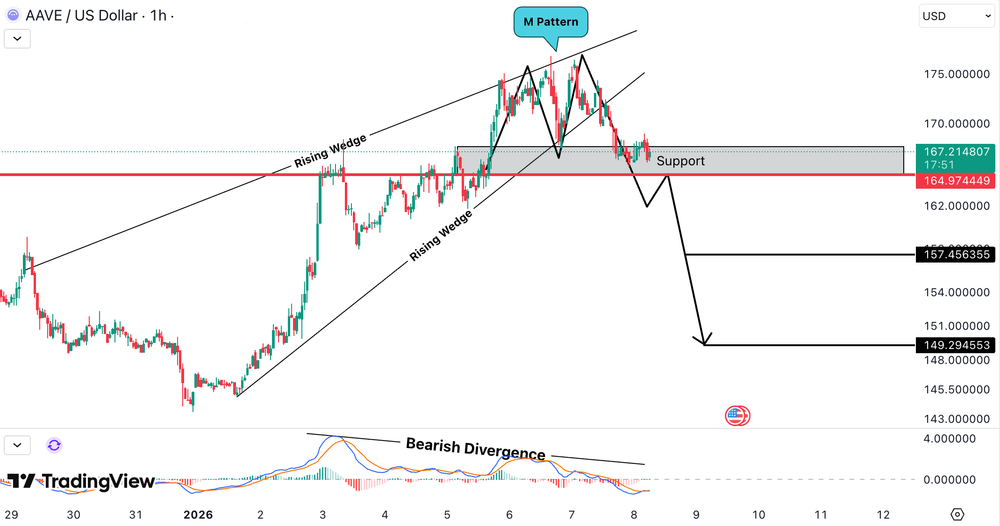
Aave (AAVE) analysis
AAVEUSD on the 1H timeframe has formed an M pattern following a rising wedge breakdown, signaling a potential bearish reversal. Price is currently hovering around the support zone at:
- 164.97 USD (≈ 151.77 EUR)
This level acts as a key decision area. Bearish divergence on momentum indicators supports the downside scenario.
A break and close below support could increase selling pressure toward:
- 157.45 USD (≈ 144.85 EUR)
- 149.29 USD (≈ 137.35 EUR)
ESTIMATION
- BTCUSD | 96H | +1% – +2% | UP | Bullish CHoCH
- ETHUSD | 96H | +1% – +3% | UP | W Pattern
- ADAUSD | 96H | +2% – +4% | UP | Descending Channel
- DOTUSD | 96H | +2% – +4% | UP | At Support
- SUSHIUSD | 96H | +2% – +4% | UP | W Pattern