
📊 Total market volume 24h: 130.21B USD (-4.94% ↓)
🔗 DeFi volume 24h: 15.89B USD | 12.20% of total (↓)
🪙 Stablecoins volume 24h: 129.24B USD | 99.26% of total (≈ stable →)
🟠 Bitcoin dominance: 59.16% (-0.06% ↓)
Bitcoin (BTC) analysis
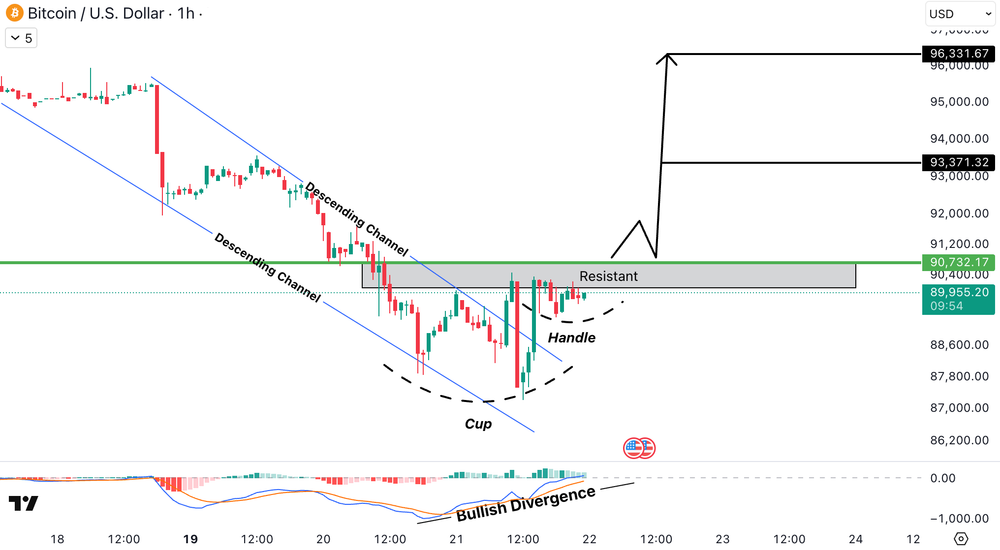
BTC/USD on the 1H timeframe has clearly broken out of the descending channel, signaling a shift in market structure toward bullish. After the breakout, price formed a rounded cup followed by a shallow handle near resistance, which suggests healthy consolidation rather than distribution. Bullish divergence on momentum further supports upside continuation.
The key confirmation zone sits between 90,700 USD (≈ 83,444 EUR) and 91,000 USD (≈ 83,720 EUR). A sustained breakout above this area can fuel a strong rally. If confirmed, upside targets are located around 93,300 USD (≈ 85,836 EUR) initially, followed by 96,300 USD (≈ 88,596 EUR). Pullbacks into the handle zone may act as short-term support before continuation.
Ethereum (ETH) analysis
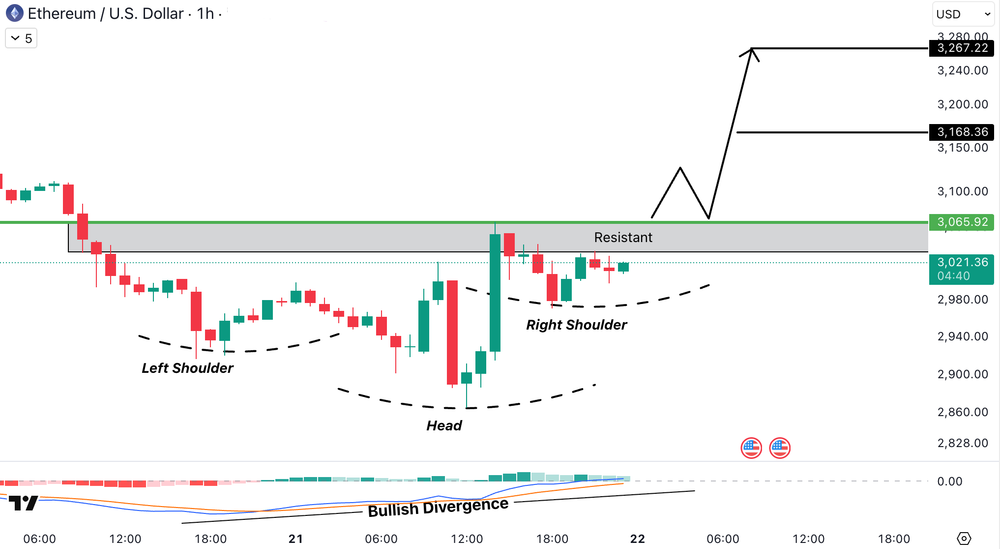
ETH/USD on the 1H timeframe is forming an inverse head and shoulders structure, with the left shoulder, head, and developing right shoulder clearly visible around the marked support. Price is consolidating below the key resistance zone between 3,050 USD (≈ 2,806 EUR) and 3,070 USD (≈ 2,824 EUR), which acts as the neckline of the pattern.
Bullish divergence on momentum indicates weakening selling pressure and increasing buyer strength. A clean breakout and sustained hold above the resistance zone would confirm the pattern, opening upside targets near 3,168 USD (≈ 2,915 EUR) first, followed by 3,267 USD (≈ 3,006 EUR). Failure to break may result in short-term consolidation before the next directional move.
MultiversX (EGLD) analysis
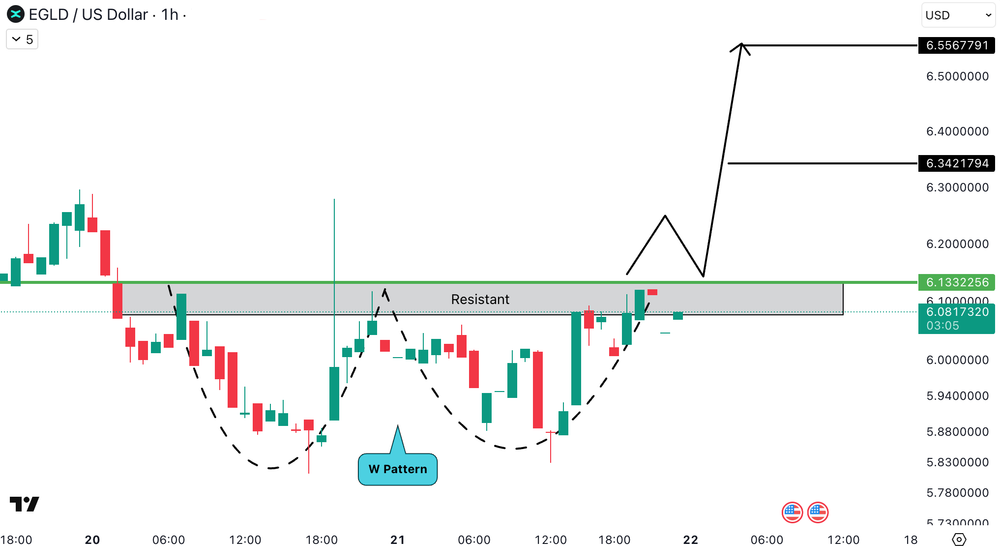
EGLD/USD on the 1H timeframe is forming a clear W pattern (double bottom), signaling a potential bullish reversal after the recent downtrend. Price rebounded strongly from the second bottom and is now consolidating just below the key resistance zone between 6.08 USD (≈ 5.59 EUR) and 6.13 USD (≈ 5.64 EUR), which acts as the neckline of the structure.
This consolidation suggests absorption of selling pressure and building bullish momentum. A strong breakout and sustained close above the resistance zone would confirm the W pattern, opening upside targets near 6.34 USD (≈ 5.83 EUR) initially and then around 6.55 USD (≈ 6.03 EUR).
Dogecoin (DOGE) analysis
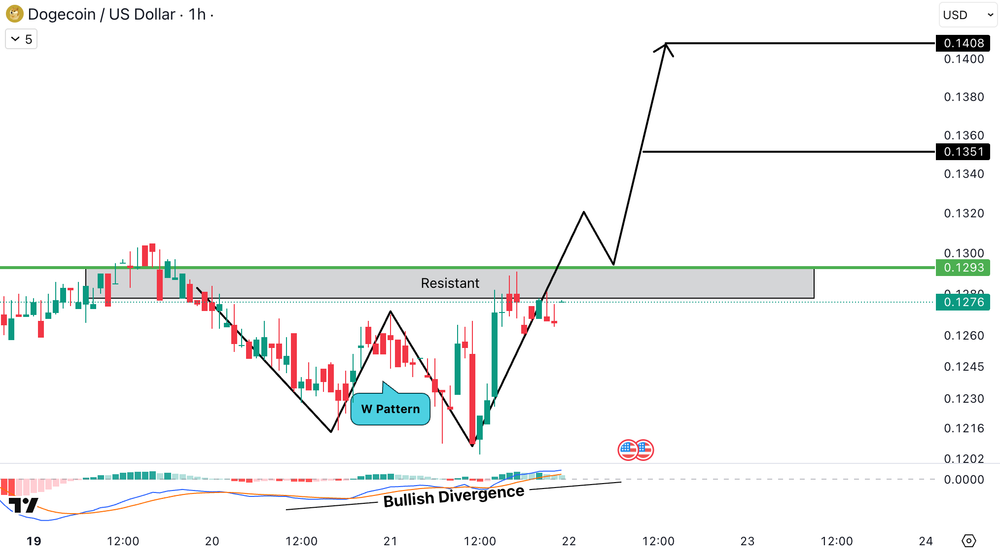
DOGE/USD on the 1H timeframe is showing a bullish reversal structure, with price forming a clear W pattern (double bottom) following a corrective move. This structure is supported by bullish divergence on the momentum indicator, signaling weakening selling pressure and increasing buyer control.
Price has pushed back into the key resistance zone between 0.128 USD (≈ 0.118 EUR) and 0.129 USD (≈ 0.119 EUR), where some short-term rejection is visible, which is normal after a strong impulsive move. A clean breakout and sustained hold above this zone would confirm bullish continuation, potentially driving price toward 0.135 USD (≈ 0.124 EUR) as the first target and 0.140–0.141 USD (≈ 0.129–0.130 EUR) as the extended upside objective.
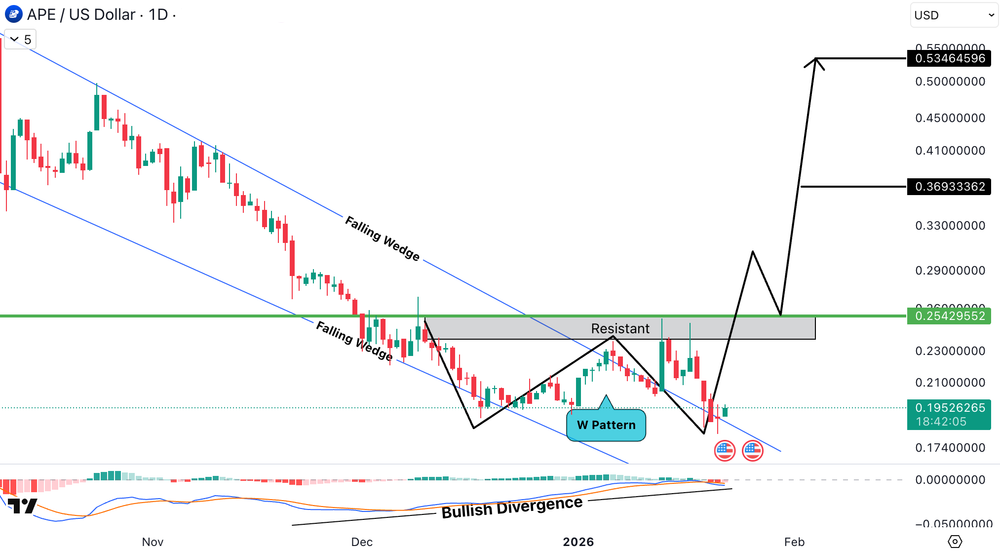
ApeCoin (APE) analysis
APE/USD on the daily timeframe is presenting a bullish reversal setup after a prolonged downtrend. Price has already broken out of a falling wedge, a classic trend-reversal pattern, and this move is further supported by a well-defined W pattern (double bottom) near the lows.
Momentum indicators are printing bullish divergence, signaling that selling pressure is weakening while buyers are gradually gaining control. Currently, price is reacting around the key resistance zone between 0.25 USD (≈ 0.23 EUR) and 0.26 USD (≈ 0.24 EUR). A successful daily close above this zone would confirm trend continuation.
If the breakout holds, the next upside targets are located around 0.36 USD (≈ 0.33 EUR) as an intermediate resistance and 0.53–0.54 USD (≈ 0.49–0.50 EUR) as the major higher-timeframe objective. As long as price maintains structure above the recent higher low around 0.18–0.19 USD (≈ 0.17–0.18 EUR), the overall bias remains bullish, with pullbacks viewed as continuation opportunities rather than trend failure.
Estimation (96H outlook)
BTCUSD
96H | +1% to +2% | UP | At Support
ETHUSD
96H | +1% to +3% | UP | Pullback Expected
ADAUSD
96H | +2% to +4% | UP | At Support
SUIUSD
96H | +2% to +4% | UP | At Support
SUSHIUSD
96H | +2% to +4% | UP | At Support
All cryptocurrencies are available for trading on Tradesilvania , and their prices can be seen on the Tradesilvania price page, accessible through the following link: https://tradesilvania.com/en/prices
With the help of our platform, you can deposit, withdraw, buy or sell any of these cryptocurrencies using the free digital wallet. SEPA Top-up (On-Ramp & Off-Ramp) Euro and RON instant transfers and over 150 cryptocurrencies, are all available in our app.
Limitation of Liability
This report issued by Tradesilvania is purely informative and is not intended to be used as a tool for making investment decisions in crypto-assets. Any person who chooses to use this report in the process of making investment decisions assumes all related risks. Tradesilvania SRL has no legal or other obligation towards the person in question that would derive from the publication of this report publicly.
The content provided on the Tradesilvania website is for informational purposes only and should not be considered as investment advice, financial advice, trading advice, or any other form of advice. We do not endorse or recommend the buying, selling, or holding of any cryptocurrency. It is important that you conduct your own research and consult with a financial advisor before making any investment decisions. We cannot be held responsible for any investment choices made based on the information presented on our website.
The information in this report was obtained from public sources and is considered relevant and reliable within the limits of publicly available data. However, the value of the digital assets referred to in this report fluctuates over time, and past performance does not indicate future growth.