
Weekly crypto market analysis (1 - 7 May)

The crypto market has experienced another neutral week. Despite the presence of volatility, most digital assets have not had significant directional movements and are largely trading at the same levels as two weeks ago.
The first days of May oscillated between periods of decline and growth, but overall the market did not move decisively and volumes were relatively low, indicating that investors are undecided about the short-term direction.
The influence of developments in stock markets was less pronounced this week, and macroeconomic data announced (FED and ECB monetary policy meetings, unemployment in the US) did not manage to establish a clear trend in the crypto market. Thus, we find BTC and ETH in the important areas of recent times, namely $29,000 and $1,900 respectively.
Excluding the frenzy of the meme-coin PEPE, which will be available on the Tradesilvania platform this week, the top 100 Market Cap crypto assets had a mixed evolution. However, a slight correction trend was felt in the market, especially on some of the altcoins that grew significantly in the first months of 2023 (OP, IMX, APT, LIDO).
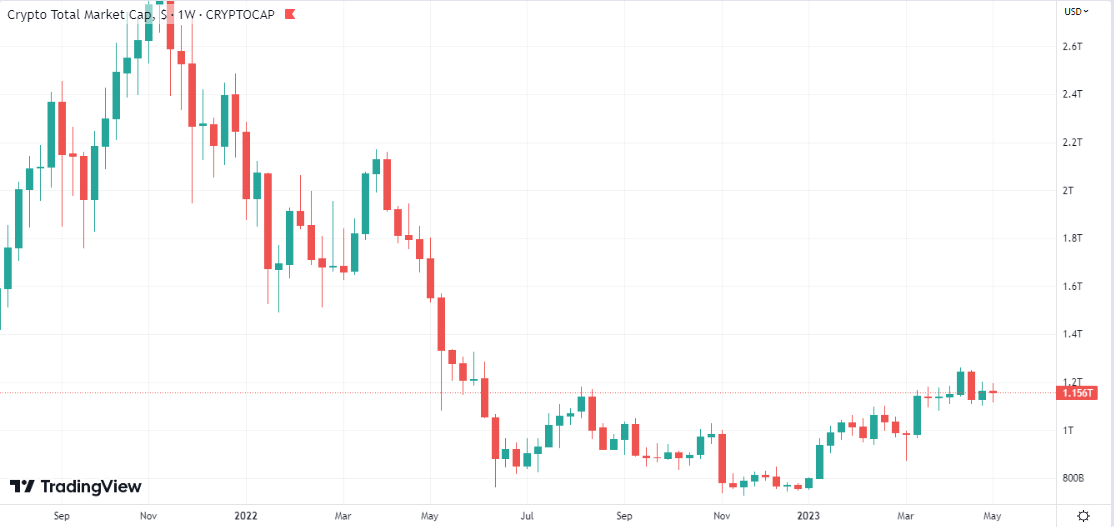
In the coming days, US inflation data will be announced, so we can expect periods of increased volatility. The total capitalization of digital assets remained in the area of $1.15 trillion .
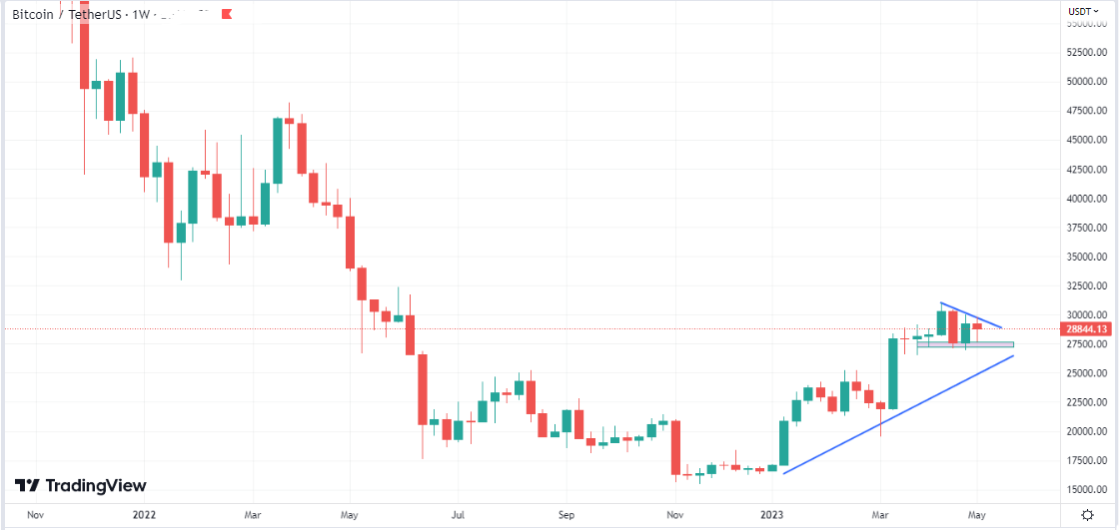
Bitcoin has had a mixed week, with the price oscillating between $27,500 and $29,500 on low trading volume, indicating investor anticipation in the market.
The first day of May brought a significant correction on BTC, with the most important crypto asset dropping from $29,500 to the $27,500 on Monday. In the following days, Bitcoin began a slight recovery, bringing the price back to the $29,500 area by the end of the week.
Technical analysis shows that BTC has not managed to make new weekly highs in the last four weeks. To re-enter an upside trend, BTC needs to break above the descending line that began in mid-April.
On the downside, there is a support area around $27,500 that must hold to maintain the positive trend of the beginning of the year.
It is possible that a price breakout of the $27,500 - $29,500 range in either direction will determine BTC’s short-to-medium-term trend and, implicitly, that of the entire crypto market.
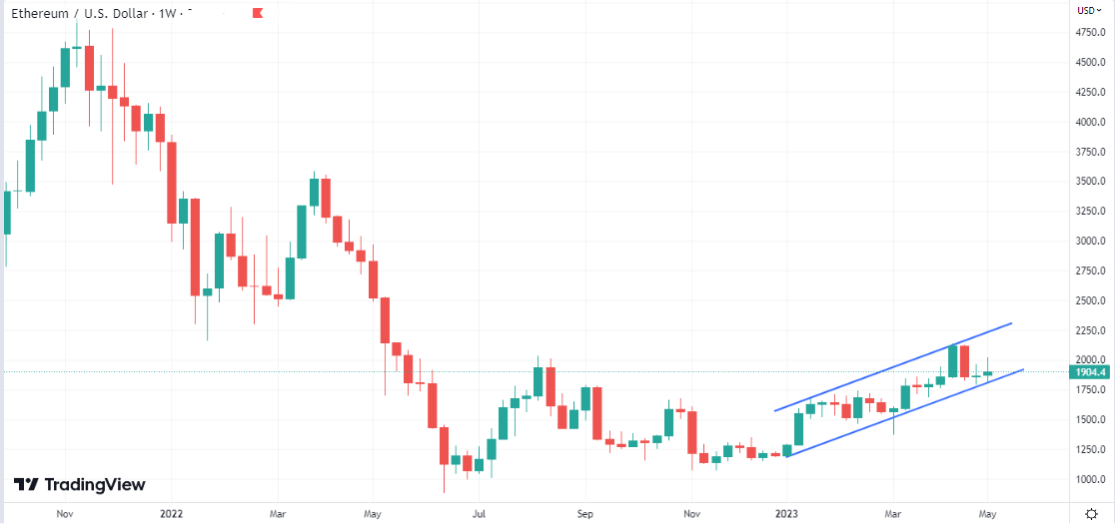
ETH has fluctuated between $1,800 - $2,000 in an indecisive week regarding the direction of the Ethereum network token.
The uncertainty in the market was reflected in ETH’s movement, which failed to establish a clear trend in the first week of May.
Technical analysis indicates that the positive trend line in place since the beginning of 2023 has acted as support, with the price being rejected upwards once the $1,750 was reached.
A potential downward break of this indicator could reverse ETH’s short-term direction and a drop to $1,500 would not be excluded. If market sentiment returns to an optimistic tone, we can expect a retest of recent highs around the $2,200.
Usually, after such periods of indecisive movements as we have seen in the last two weeks, a more significant evolution may follow that will determine the trend, at least in the short term.
The direction in which this evolution could occur is uncertain, with the chart pattern showing potential for both options. Moreover, movements in international stock markets must also be taken into account as they are also in important areas that can set the direction for the coming months.
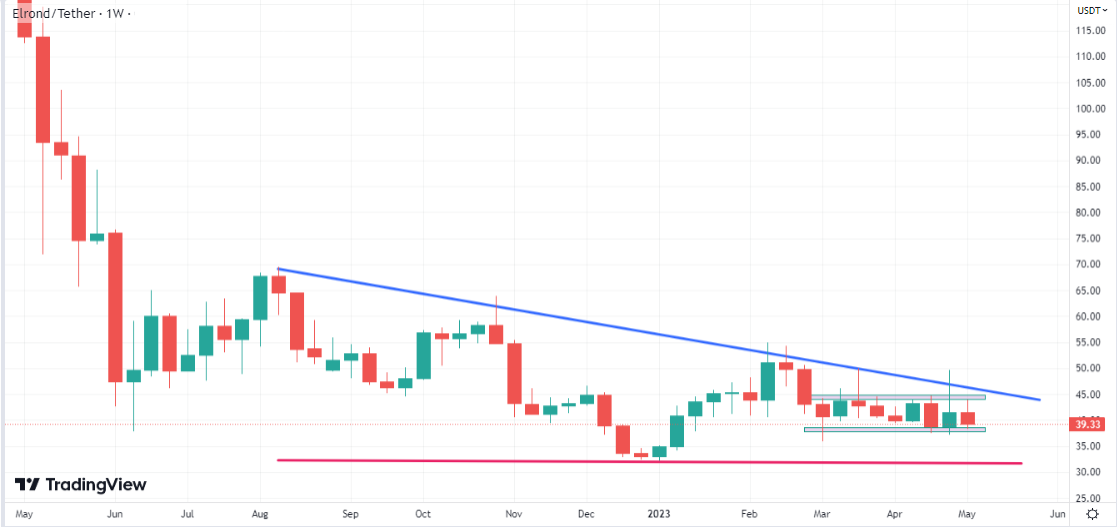
EGLD has continued to trade in the $38 - $45 range, where the MultiversX network crypto asset has been trading since the beginning of March.
Fundamentally, the blockchain team constantly brings upgrades to the MultiversX ecosystem on all levels (Web3, NFTs, network operability, etc.), but the general uncertainty in the market causes the evolution of the EGLD token to align with overall movements in the crypto sphere.
Thus, recent weeks have brought neutral developments for eGold and even though we have seen positive reactions to EGLD’s movement after each announcement by the team, in the end, market direction was decisive in determining the price at which the MultiversX token is traded.
From a technical perspective, we need a convincing breakout of either of the $38 - $45 range limits to determine the direction for the coming months.
A downward break could take EGLD towards its 12-month lows in the $32 area, while a decisive rise above $45 would create the necessary momentum for a retest of recent highs at $55.
Limitation of Liability
This report issued by Tradesilvania is purely informative and is not intended to be used as a tool for making investment decisions in crypto-assets. Any person who chooses to use this report in the process of making investment decisions assumes all related risks. Tradesilvania SRL has no legal or other obligation towards the person in question that would derive from the publication of this report publicly.
The information in this report was obtained from public sources and is considered relevant and reliable within the limits of publicly available data. However, the value of the digital assets referred to in this report fluctuates over time, and past performance does not indicate future growth.
Total or partial reproduction of this report is permitted only by mentioning the source.