Vedere de ansamblu a pietei crypto si evolutia din ultima zi (24 ore)
🌍 Market cap crypto global: 3.13T USD (↓ 2.67%)
🔄 Volum total piata 24h: 108.08B USD (↑ 78.53%)
🧩 Volum DeFi 24h: 13.53B USD | 12.52% din total (↑)
🪙 Volum stablecoins 24h: 104.76B USD | 96.92% din total (↑)
🟠 Dominanta Bitcoin: 59.10% (↑ 0.14%)
Bitcoin (BTC) analysis
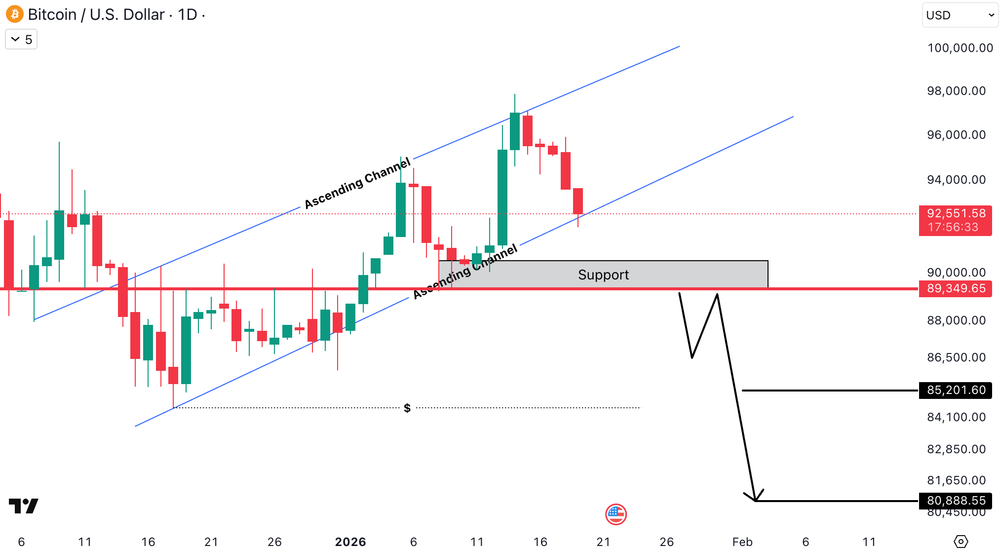
BTCUSD pe timeframe daily se tranzactioneaza in continuare in interiorul unui ascending channel, ceea ce indica faptul ca structura bullish de ansamblu ramane valida pentru moment. Pretul reactioneaza acum in zona mediana spre inferioara a canalului si se apropie de suportul orizontal cheie din jurul nivelului de 89,350.00 USD (≈82,202 EUR), care functioneaza ca zona de decizie.
Atata timp cat acest suport si lower trendline-ul canalului sunt mentinute, este posibila o revenire catre zona superioara a canalului. In schimb, o spargere clara si un daily close sub aceasta zona ar putea schimba momentum-ul in bearish, deschizand tinte de scadere in zona 85,200.00 USD (≈78,384 EUR) si ulterior 80,888.00 USD (≈74,417 EUR).
Ethereum (ETH) analysis
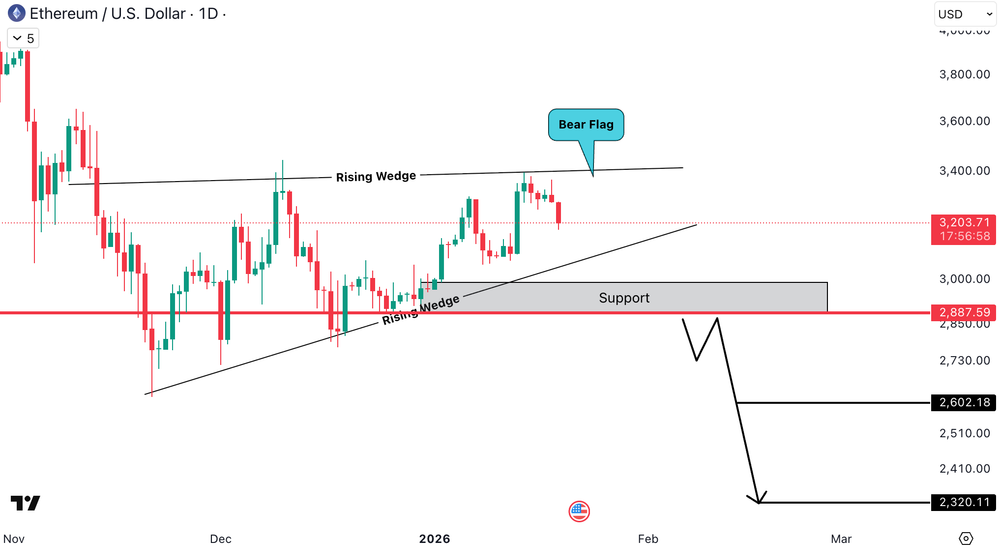
ETHUSD pe timeframe daily se tranzactioneaza intr-un rising wedge, iar recent a format un bear flag, ceea ce creste probabilitatea unei continuari bearish. Momentum-ul slabeste in apropierea rezistentei superioare a wedge-ului, in timp ce zona de suport cheie se afla in jurul nivelului de 2,887.00 USD (≈2,656 EUR).
Cat timp pretul ramane sub rezistenta wedge-ului, presiunea de scadere ramane dominanta. O confirmare a breakdown-ului si un daily close sub 2,887.00 USD (≈2,656 EUR) pot deschide drumul catre 2,602.00 USD (≈2,394 EUR) ca prima tinta, urmata de un move mai adanc spre 2,320.00 USD (≈2,134 EUR).
MultiversX (EGLD) analysis
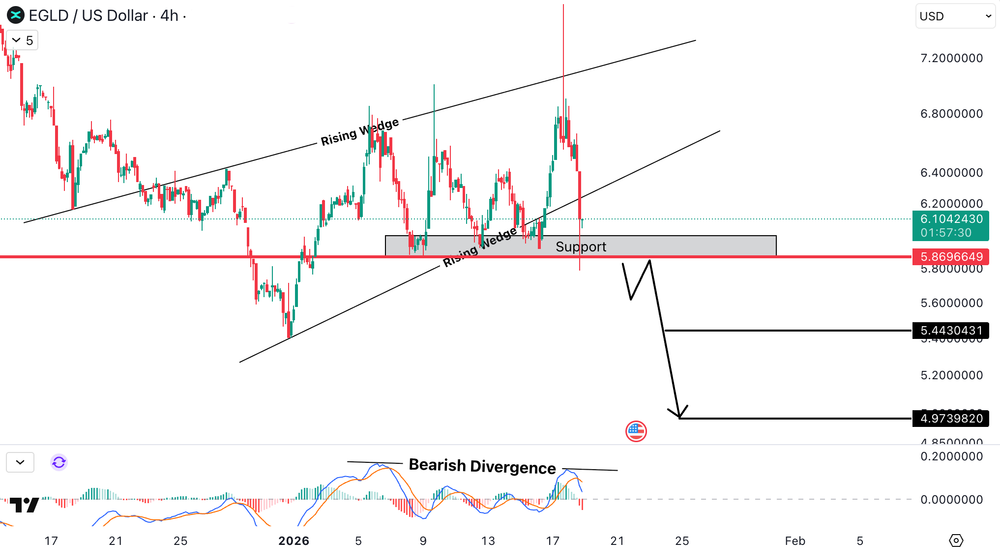
EGLDUSD pe timeframe 4H se tranzactioneaza intr-un rising wedge si a aratat un rejection puternic din partea superioara a structurii, sustinut de o bearish divergence clara, ceea ce creste probabilitatea unui move de scadere. Pretul reactioneaza in prezent in jurul zonei de suport cheie de 5.87 USD (≈5.40 EUR).
Un breakdown confirmat si un candle close sub acest suport ar valida scenariul bearish si ar putea declansa o scadere catre 5.44 USD (≈5.00 EUR) ca prima tinta, urmata de un move mai amplu catre 4.97 USD (≈4.57 EUR).
Binance Coin (BNB) analysis
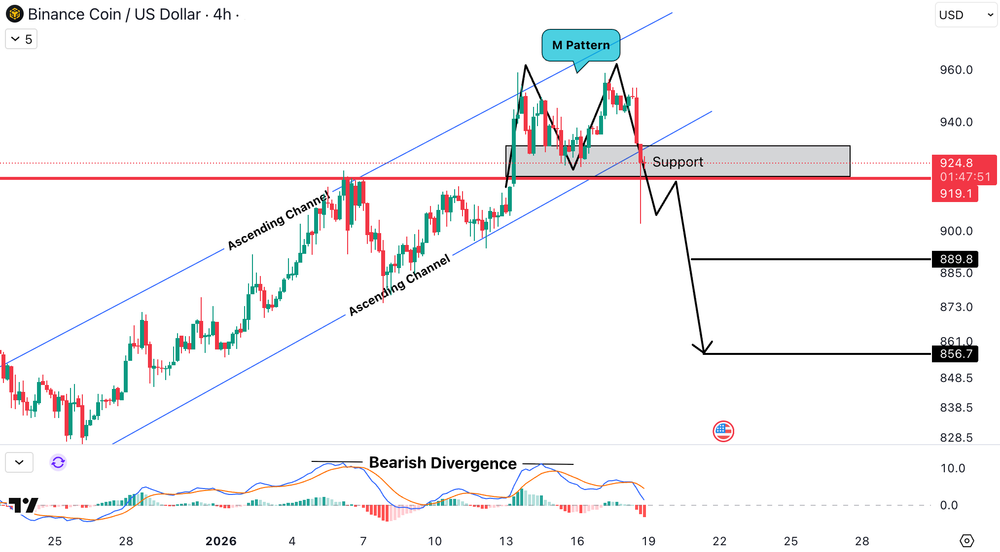
BNB/USDT pe timeframe 4H se tranzactioneaza in continuare intr-un ascending channel, insa momentum-ul s-a slabit vizibil. Pretul a format un M-pattern in apropierea maximului canalului, sustinut de o bearish divergence evidenta, semnaland cresterea presiunii din partea vanzatorilor.
In prezent, pretul testeaza zona critica de suport din jurul nivelului de 919.00 USD (≈845 EUR), care actioneaza ca zona de decizie. Atata timp cat lumanarile se mentin peste acest nivel, un breakdown confirmat nu a avut loc. Totusi, un 4H close clar sub suport poate deschide calea catre 889.00 USD (≈818 EUR) si ulterior 857.00 USD (≈789 EUR).
Solana (SOL) analysis
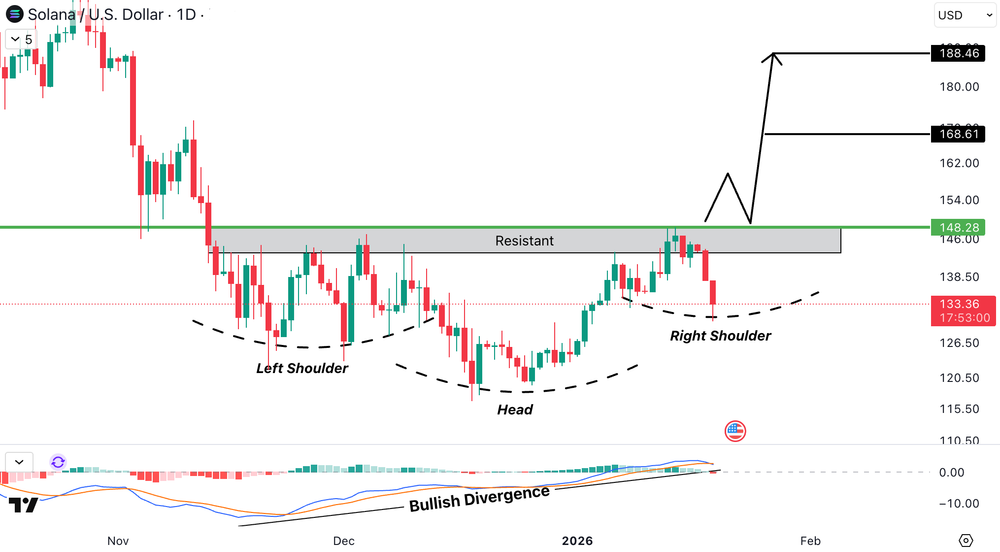
SOL/USD pe timeframe daily formeaza o structura de inverse head and shoulders, cu left shoulder si head deja formate, iar right shoulder fiind in curs de dezvoltare. Pretul se tranzactioneaza sub zona de rezistenta cheie din jurul 148.00 USD (≈136 EUR), care functioneaza ca neckline.
Cat timp aceasta rezistenta nu este recuperata decisiv, pattern-ul ramane incomplet. Cu toate acestea, bullish divergence pe indicatorii de momentum sustine un posibil upside reversal. Un daily close puternic peste rezistenta ar putea declansa un breakout catre 168.00 USD (≈155 EUR) si 188.00 USD (≈173 EUR). In schimb, incapacitatea de a mentine zona 130–133 USD (≈120–122 EUR) poate intarzia scenariul bullish.
Estimation (96H)
- BTCUSD: 1% – 2% DOWN
Context: geo-political scenario (TRUMP) - ETHUSD: 1% – 3% DOWN
Context: sell on high - XRPUSD: 2% – 4% DOWN
Pattern: inverse cup & handle - APEUSD: 2% – 4% DOWN
Pattern: M pattern - AVAXUSD: 2% – 4% DOWN
Pattern: M pattern
Cu ajutorul platformei Tradesilvania vei putea incasa, plati, cumpara sau vinde oricare dintre aceste criptomonede utilizand portofelul digital gratuit. Descopera tranzactionarea directa cu RON si EURO si cele peste 150 de criptomonede disponibile in platforma.
Prezentul raport emis de Tradesilvania are un caracter pur informativ si nu este realizat in scopul utilizarii ca instrument in procesul de luare a deciziilor de investitii in crypto-active. Orice persoana care intelege sa foloseasca prezentul raport in procesul de luare a deciziilor de investitii, isi asuma in mod expres toate riscurile aferente, Tradesilvania SRL neavand nicio obligatie legala sau de orice alta natura fata de persoana in discutie, ce ar deriva din publicarea acestui raport public.
Informatiile care stau la baza prezentului raport au fost obtinute din surse publice, considerate, in limita datelor disponibile publice, relevante si de incredere.