Crypto market in the last 24h:
🌐 Global market cap: $2.7T (+0.02%)
📊 24-hour total volume: $96.73B (-18.34%)
💰 DeFi volume: $6.11B (6.32% of total volume)
🔒 Stablecoins volume: $91.11B (94.20% of total volume)
💵 Bitcoin dominance: 60.93% (-0.23%)
Bitcoin (BTC) Analysis
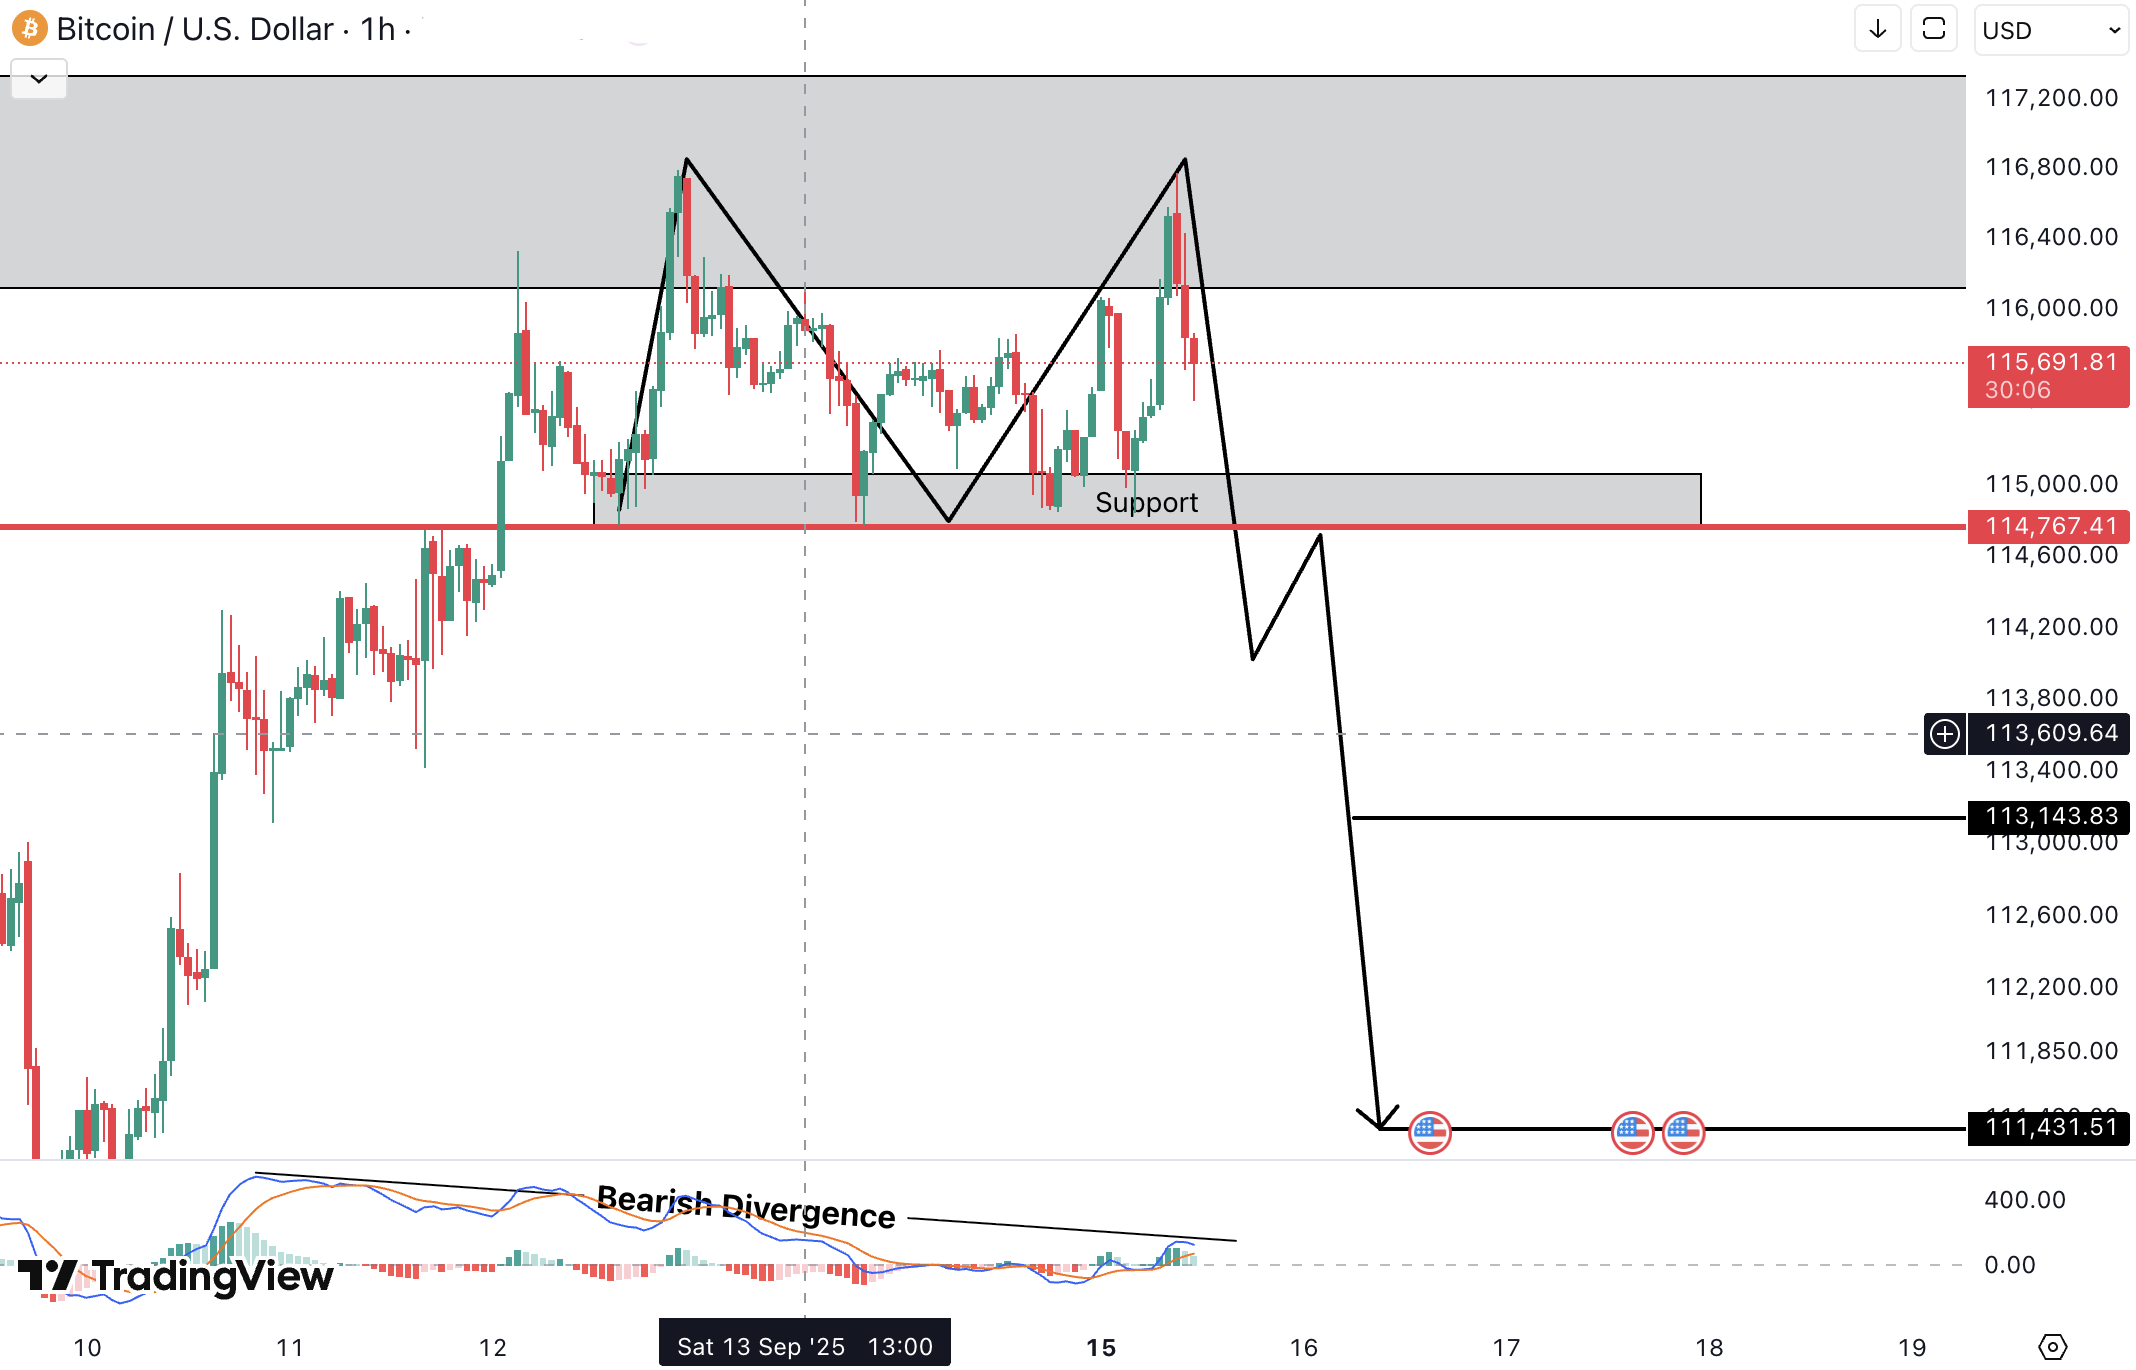
BTC is offering opportunities for both bullish and bearish moves. On the bullish side, it has formed an inverse head & shoulders pattern, increasing the probability of an upward move. However, for confirmation, we need a breakout and candle closing above the resistance zone of 84434 USD, which could then target 87175 USD and 90267 USD.
On the bearish side, BTC has also formed a bear flag with bearish divergence, suggesting a potential downward move. For confirmation, a breakdown and candle closing below the support zone of 80936 USD would be needed, which could then lead to targets of 79139 USD and 77227 USD.
Ethereum (ETH) Analysis
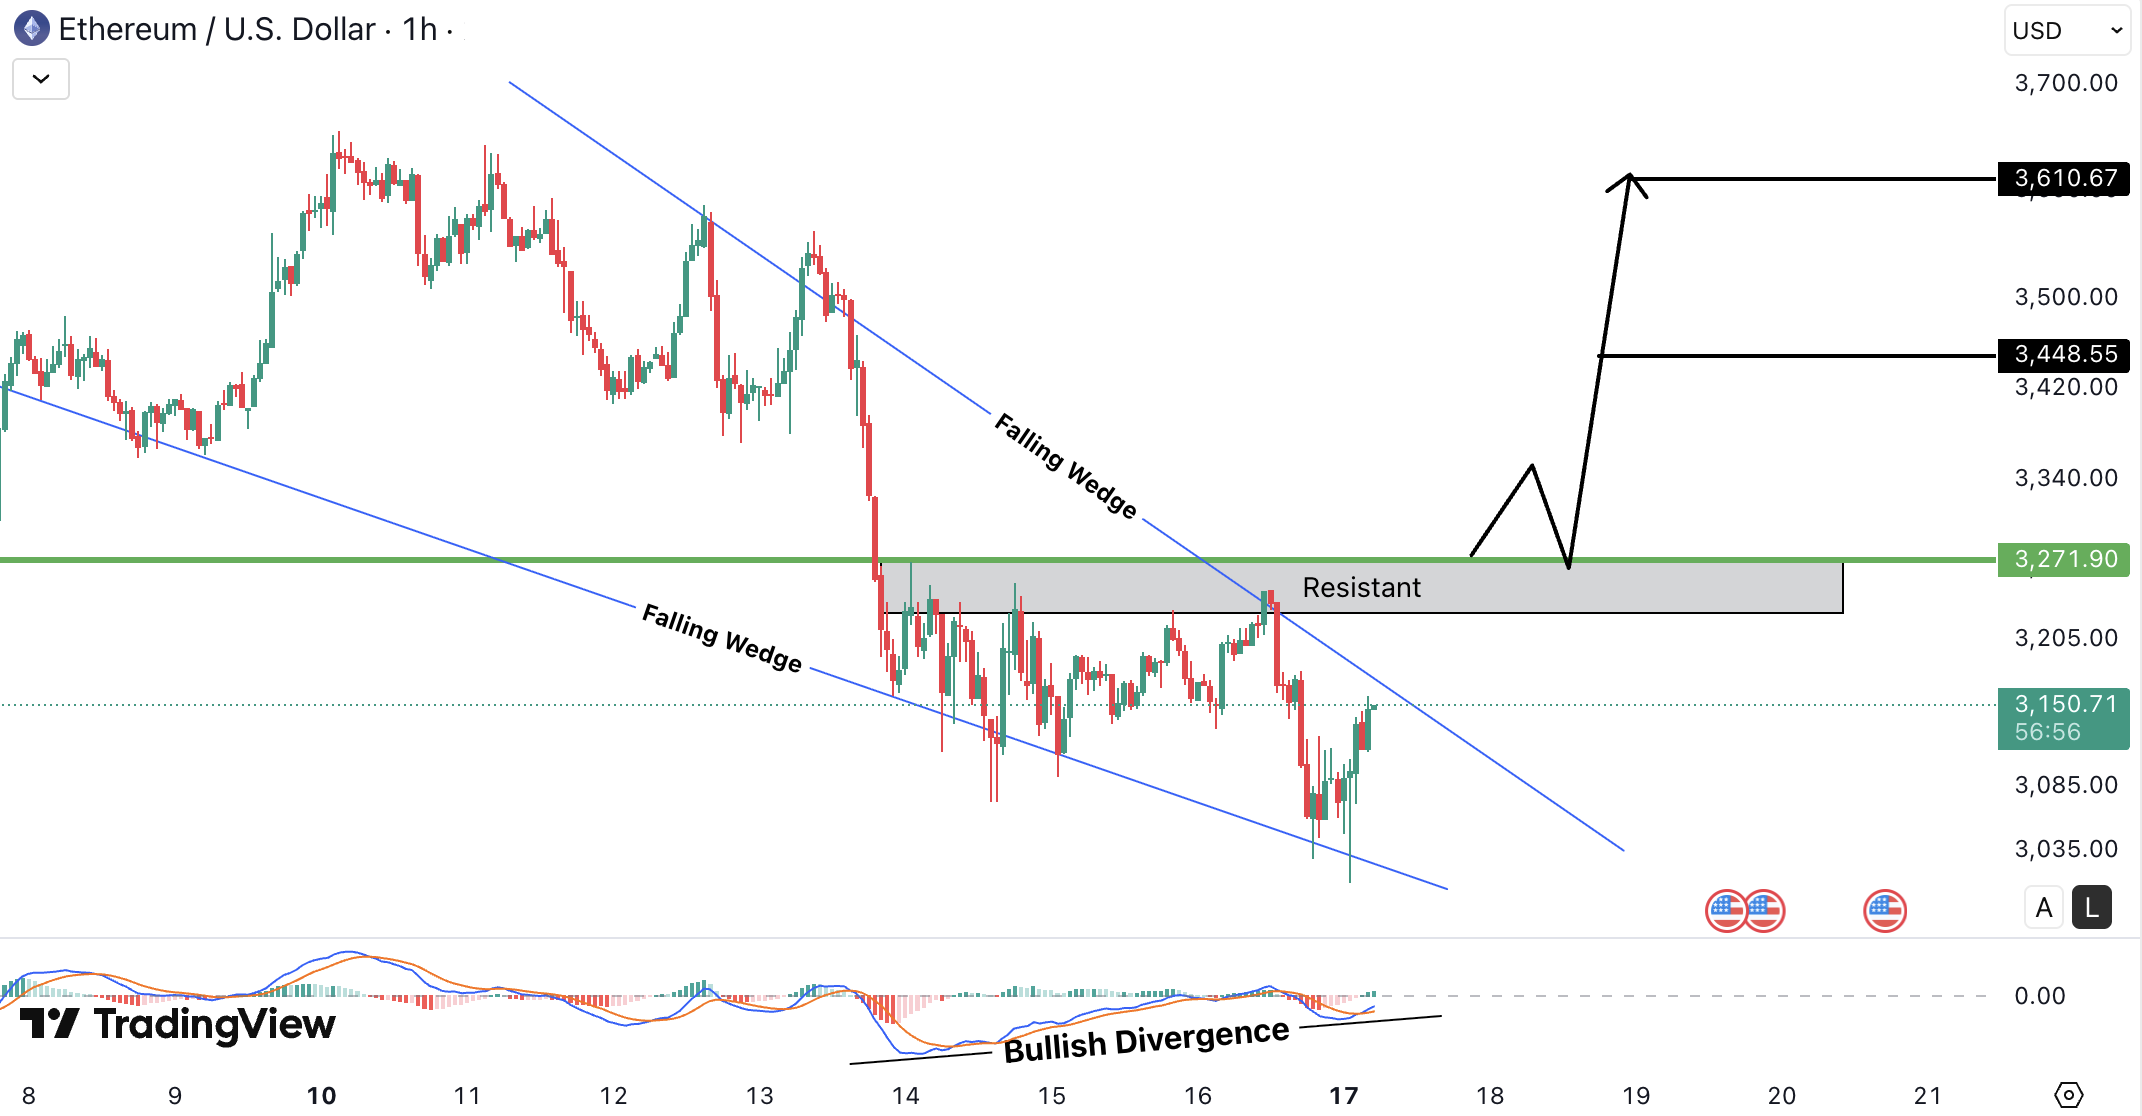
ETH is looking bearish due to the formation of a bear flag pattern, which increases the probability of a continuation of the downtrend. However, for confirmation, we need a breakdown and candle closing below the support zone of 1834 USD, which could then lead to targets of 1730 USD and 1649 USD.
MultiversX (EGLD) Analysis
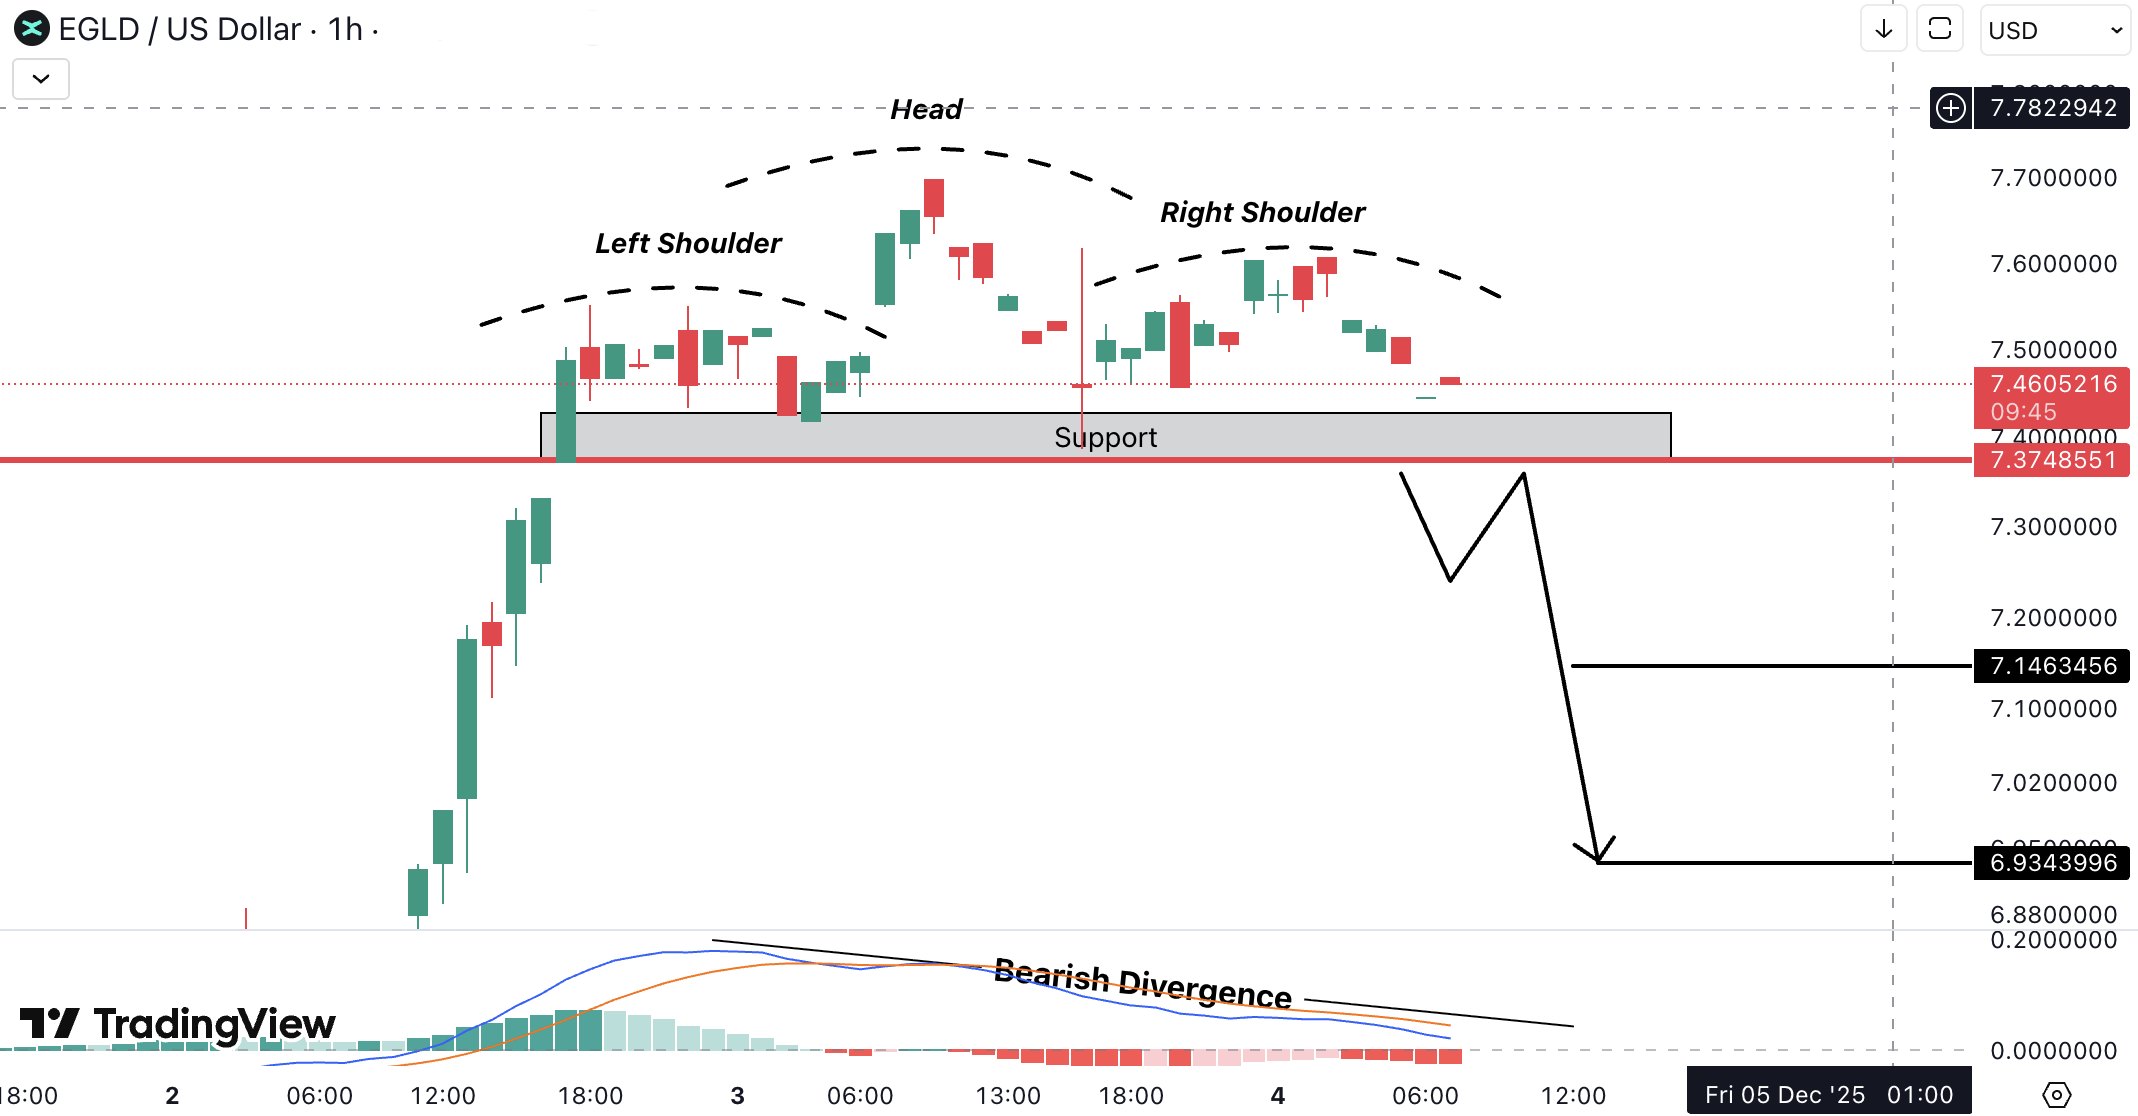
EGLD is looking bearish due to the formation of a head & shoulders pattern, which increases the probability of a downtrend. However, for confirmation, we need a breakdown and candle closing below the support zone of 17.76 USD, which could then give us the targets of 17.34 USD and 16.91 USD.
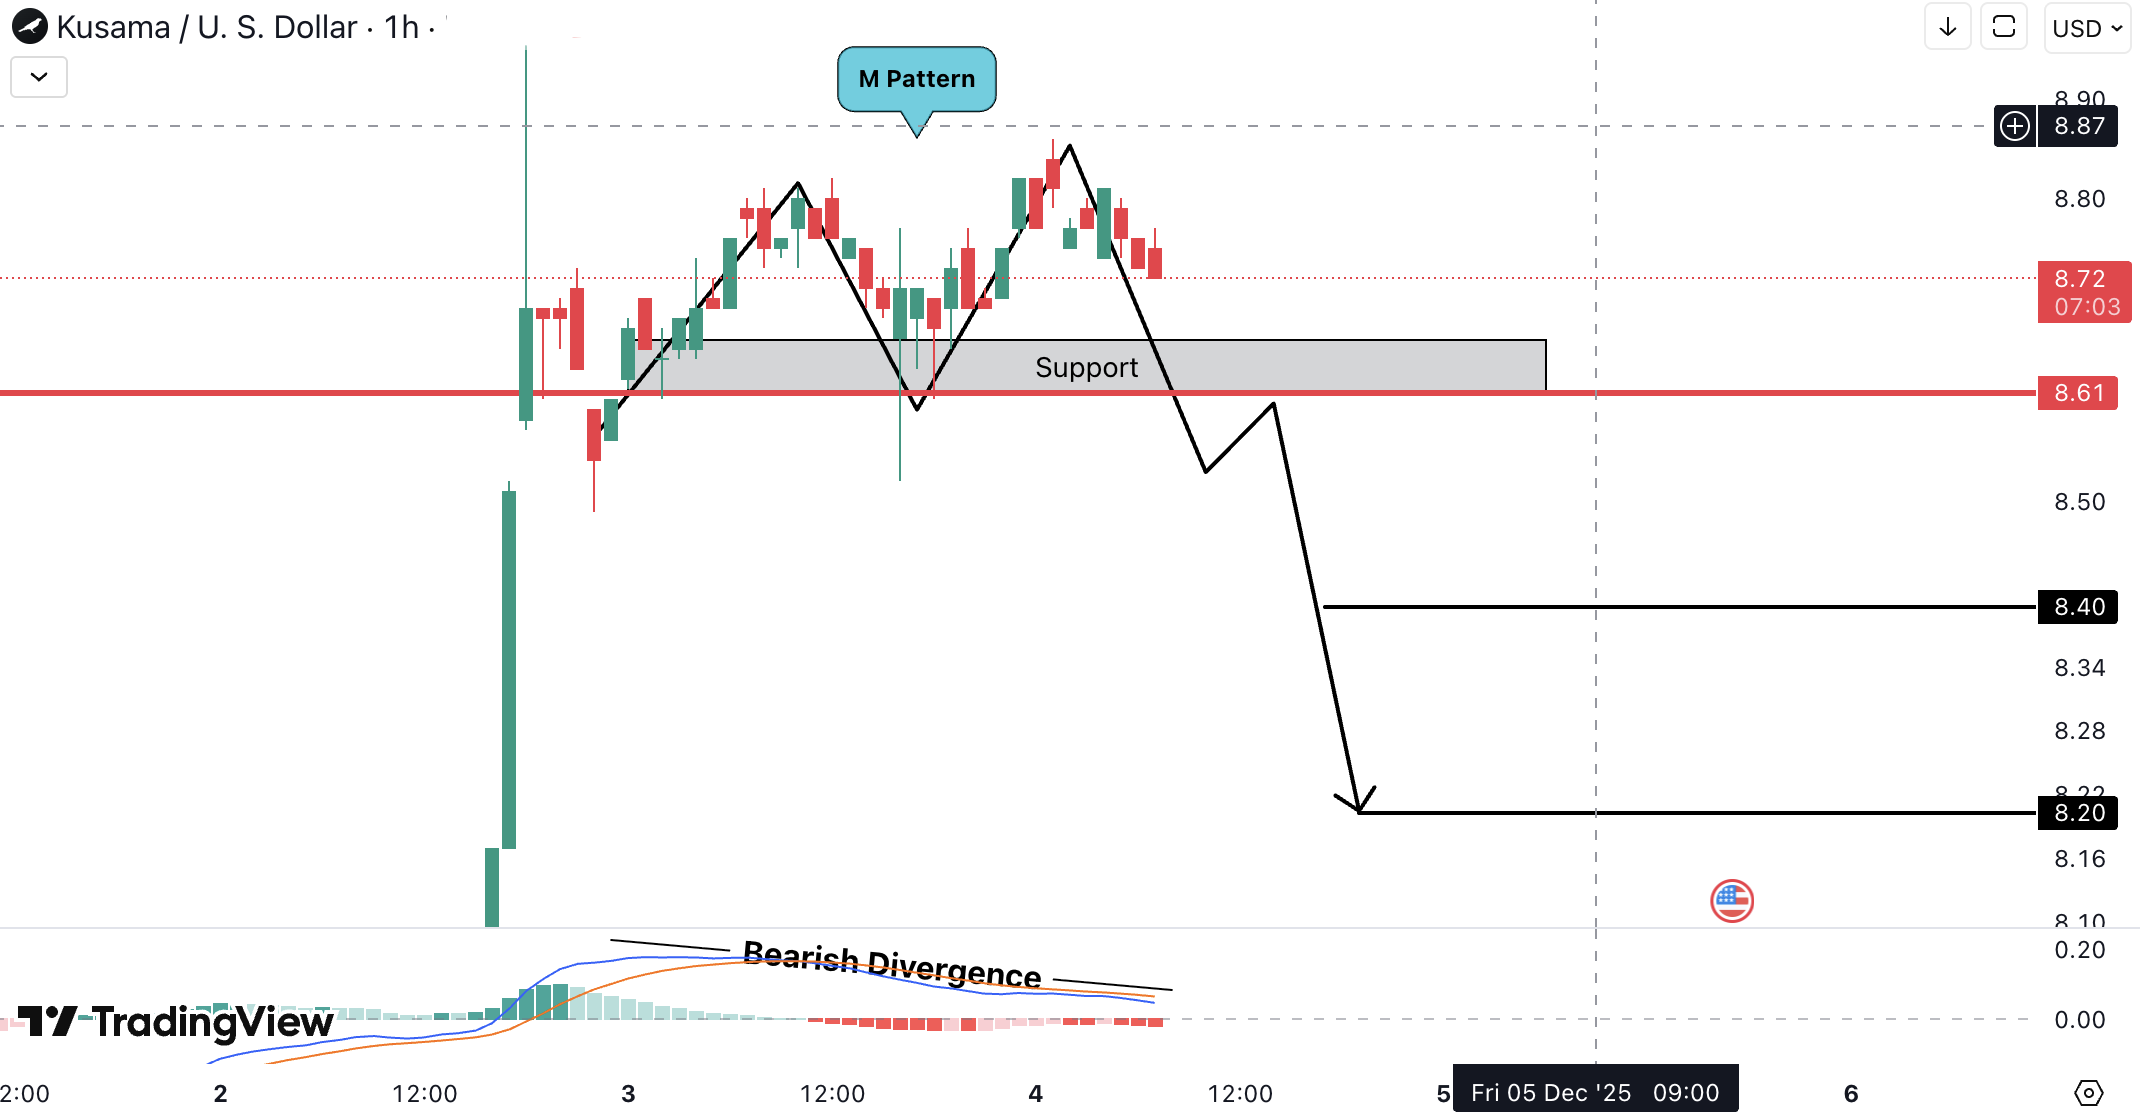
Kusama (KSM) Analysis
KSM is showing a strong bullish setup due to the presence of a resistive trendline, a W pattern, and bullish divergence, all of which increase the probability of an upward move. However, for confirmation, we need a breakout and candle closing above the resistance zone of 16.45 USD, which could then give us the targets of 17.33 USD and 18.51 USD.
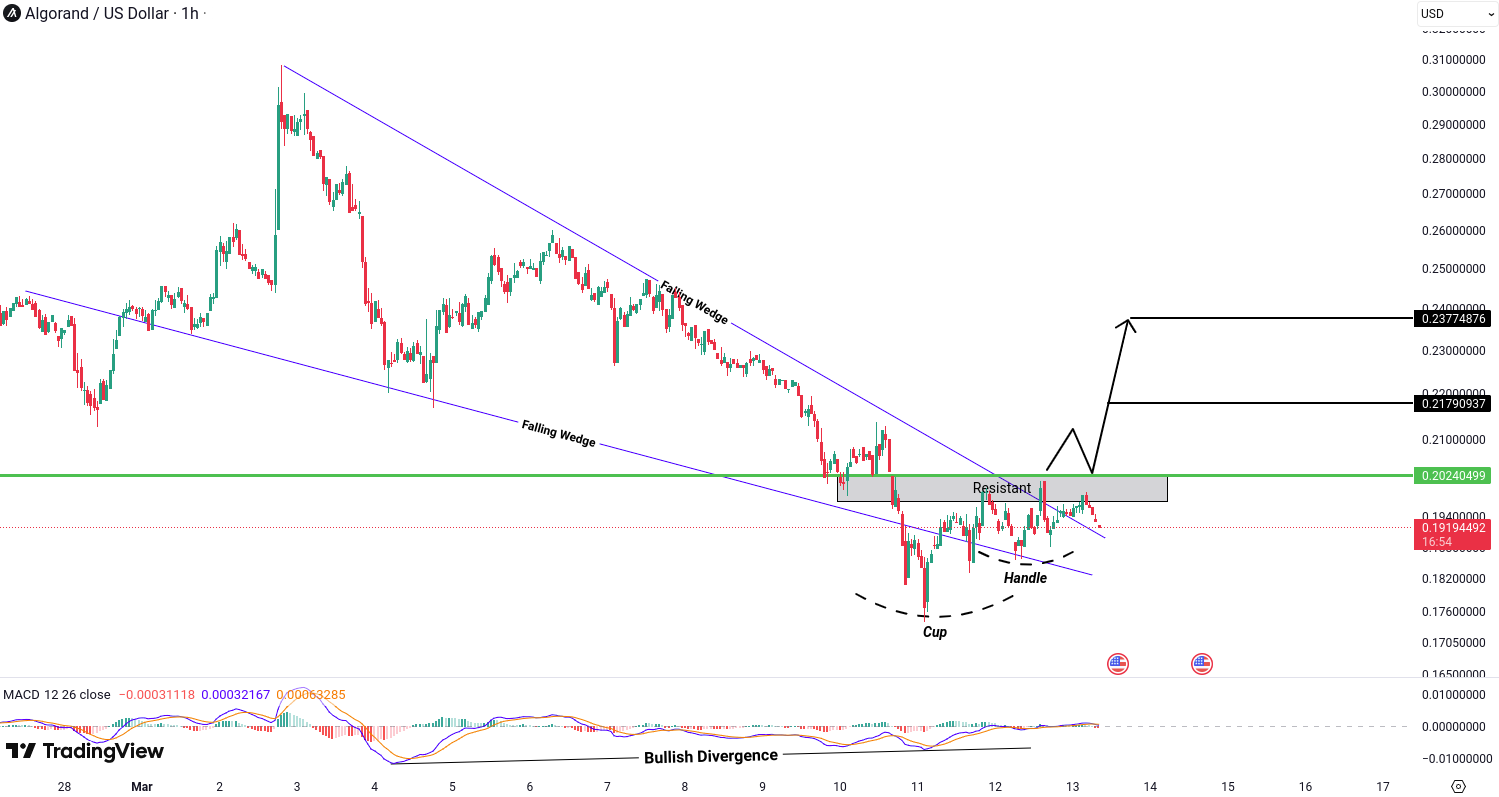
Algorand (ALGO) Analysis
ALGO has formed a falling wedge along with a cup & handle pattern and bullish divergence, all of which together increase the probability of a bullish move. However, for confirmation, we need a breakout and candle closing above the resistance zone of 0.20240499 USD, which can then give us the targets of 0.21790937 USD and 0.23774876 USD.
All cryptocurrencies are available for trading on Tradesilvania , and their prices can be seen on the Tradesilvania price page, accessible through the following link: https://tradesilvania.com/en/prices
With the help of our platform, you can deposit, withdraw, buy or sell any of these cryptocurrencies using the free digital wallet. SEPA Top-up (On-Ramp & Off-Ramp) Euro and RON instant transfers and over 100 cryptocurrencies, are all available in our app.

Limitation of Liability
This report issued by Tradesilvania is purely informative and is not intended to be used as a tool for making investment decisions in crypto-assets. Any person who chooses to use this report in the process of making investment decisions assumes all related risks. Tradesilvania SRL has no legal or other obligation towards the person in question that would derive from the publication of this report publicly.
The content provided on the Tradesilvania website is for informational purposes only and should not be considered as investment advice, financial advice, trading advice, or any other form of advice. We do not endorse or recommend the buying, selling, or holding of any cryptocurrency. It is important that you conduct your own research and consult with a financial advisor before making any investment decisions. We cannot be held responsible for any investment choices made based on the information presented on our website.
The information in this report was obtained from public sources and is considered relevant and reliable within the limits of publicly available data. However, the value of the digital assets referred to in this report fluctuates over time, and past performance does not indicate future growth.