💰 The total crypto market capitalization of the global cryptocurrency market is currently €1.09 trillion, experiencing a decrease of 2.60% in the last day.
💼 The total trading volume of the cryptocurrency market in the past 24 hours is €29.07 billion, reflecting a decrease of 11.85% compared to the previous day. This decrease may be a result of reduced investor sentiment and lower market activity.
📊 The total volume of Decentralized Finance (DeFi) is currently €2.46 billion, accounting for 8.45% of the total cryptocurrency market volume in the last 24 hours.
💱 The volume of all stablecoins currently stands at €26.13 billion, representing 89.88% of the total crypto market volume in the last 24 hours.
💪 Bitcoin (BTC) dominance is currently at 49.65%, experiencing an increase of 0.08% during the day. Bitcoin continues to be the most influential and widespread cryptocurrency in the market.
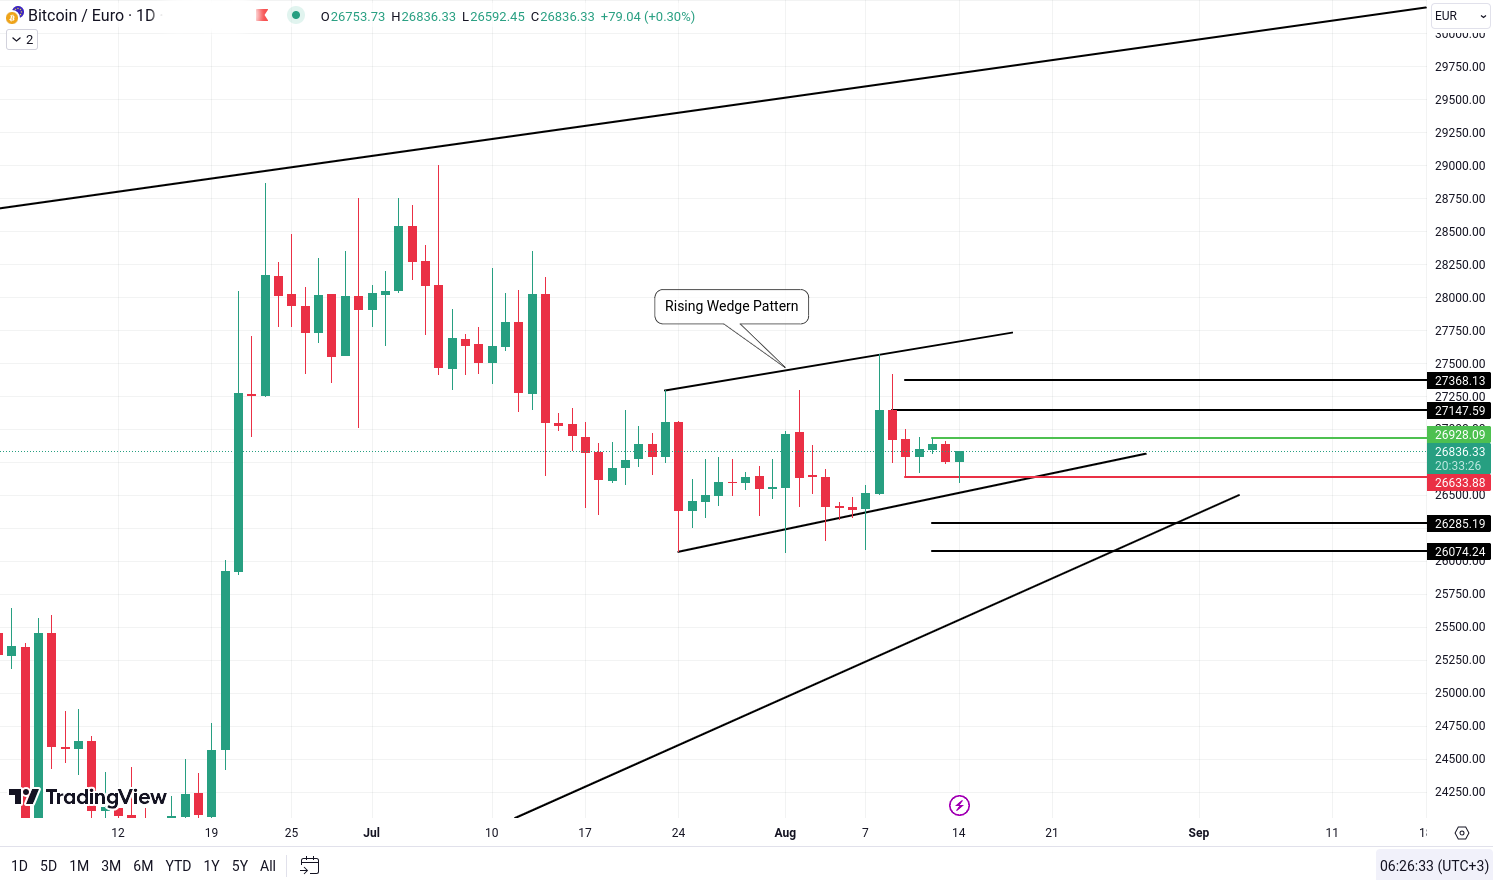
Bitcoin (BTC) analysis and update
In the context of BTC, the falling wedge pattern has garnered attention from traders and analysts, attracting interest due to its technical implications. The upper trendline represents a critical resistance level, while the lower trendline functions as a support level. At present, Bitcoin’s price has been oscillating within the boundaries of this pattern, creating anticipation for a potential breakout in either direction.
Upside Breakout: If Bitcoin (BTC) successfully surpasses the upper trendline of the falling wedge pattern, it would signal a bullish trend. This breakout would indicate that buyers have gained control and are driving the price upwards. In such a scenario, traders and investors may anticipate the following price targets: 28,507 Euro and 28,630 Euro. These levels could serve as potential resistance points, where some profit-taking activities might occur.
Downside Breakout: Conversely, if Bitcoin’s price breaks below the lower trendline of the falling wedge pattern, it would indicate a bearish outlook. This breakdown would suggest that sellers have taken charge, potentially leading to a further decline in price. In such a situation, traders may consider the following price targets: 28,068 Euro and 27,915 Euro. These levels could act as support, temporarily halting the downward momentum.
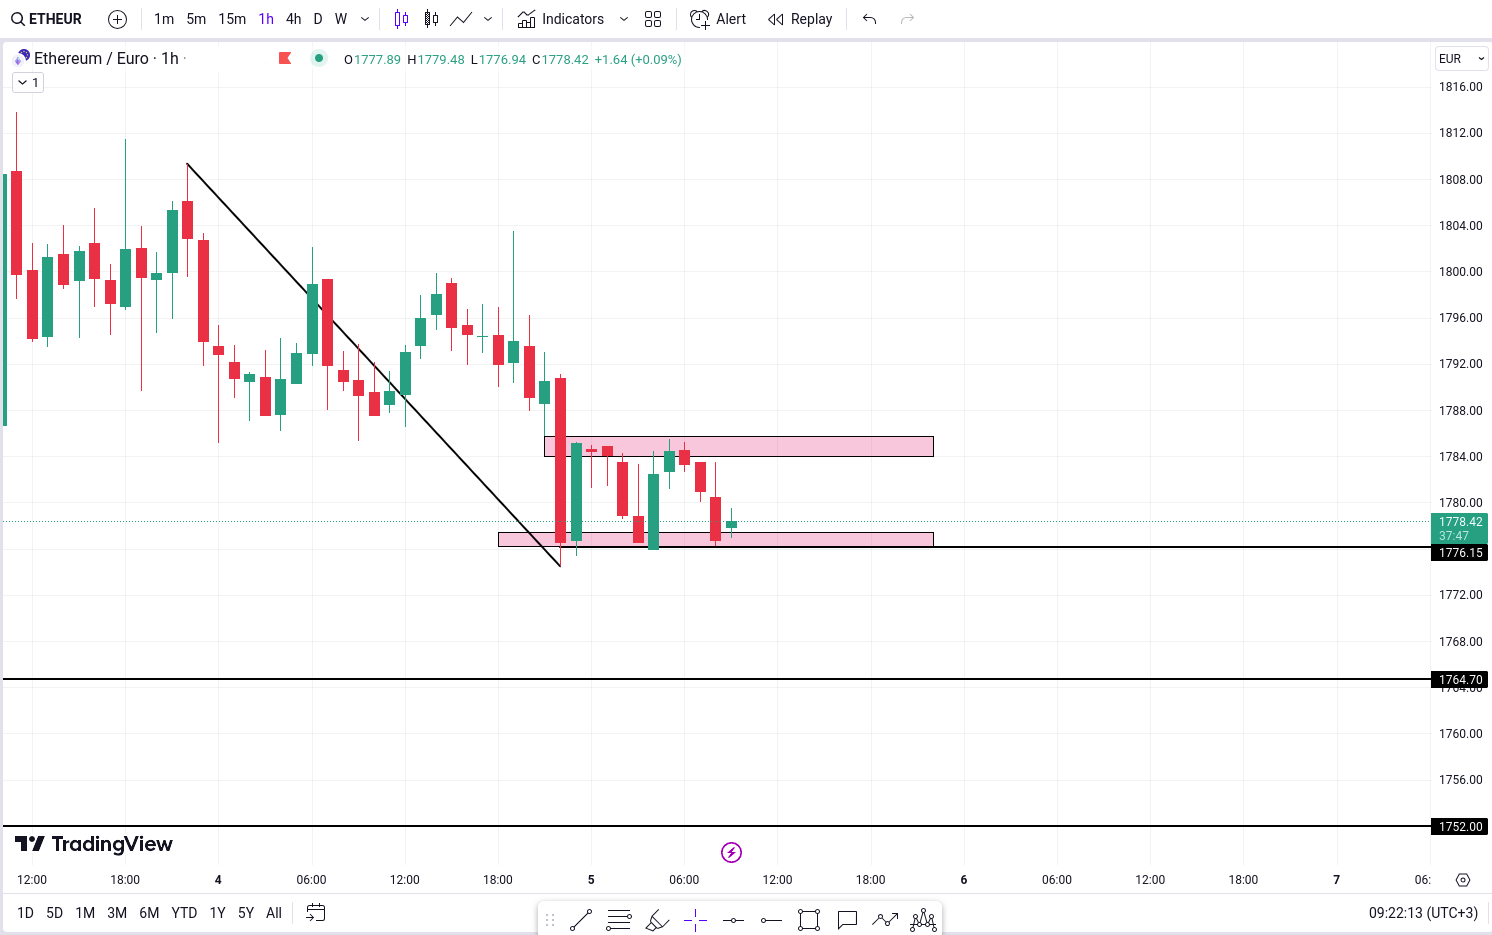
Ethereum (ETH) analysis and update
Ethereum pair has recently exhibited the formation of a bearish flag pattern, suggesting a potential extension of the ongoing downtrend. It is crucial for investors to closely observe the support level at 1,776 Euro, as a decisive breach below this level would serve as confirmation of the bearish sentiment. In such a scenario, downside targets of 1,764 Euro and 1,752 Euro may come into play, indicating possible areas where the price could find further support. Traders are advised to exercise caution and carefully assess market conditions before making any investment decisions.
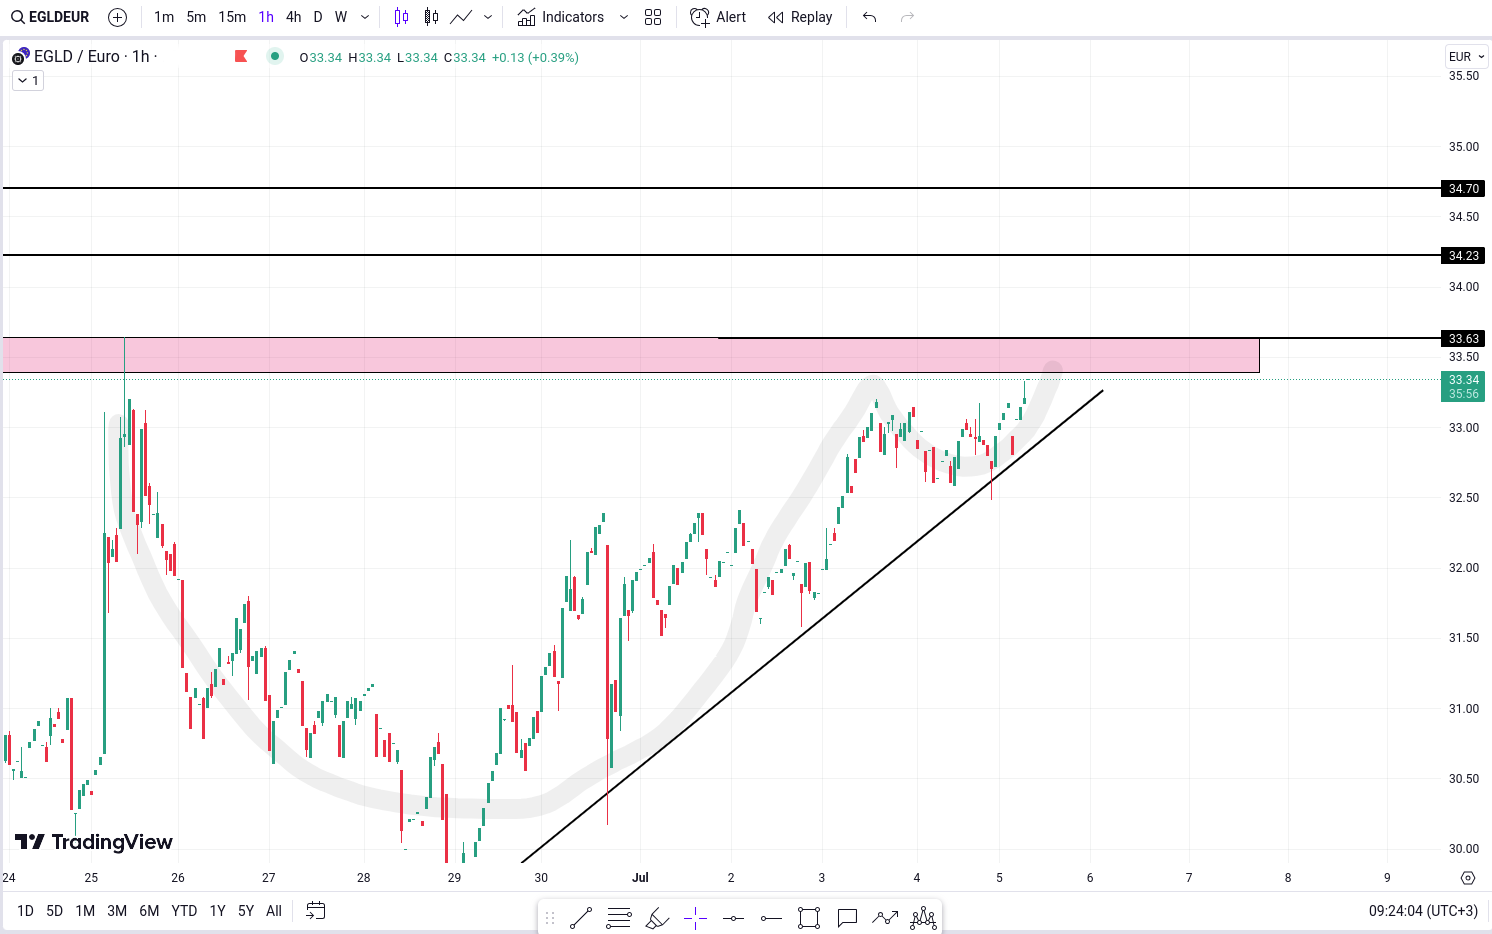
MultiversX (EGLD) analysis and update
EGLD has attracted the attention of investors due to the emergence of a potentially bullish cup and handle pattern. This pattern suggests that Elrond’s price has formed a rounded bottom, followed by a consolidation phase. Seasoned traders are carefully monitoring the crucial level of 33.63 Euro, as a breakthrough above this level would validate the pattern and indicate a potential continuation of the bullish trend.
In the event that EGLD/EUR successfully surpasses the resistance level of 33.63 Euro, it would confirm the presence of the bullish cup and handle pattern. This breakout would signify that buyers have regained control and are likely to propel the price upwards. In such a scenario, traders may consider the following upward targets: 34.23 Euro and 34.70 Euro.
Litecoin (LTC) analysis and update
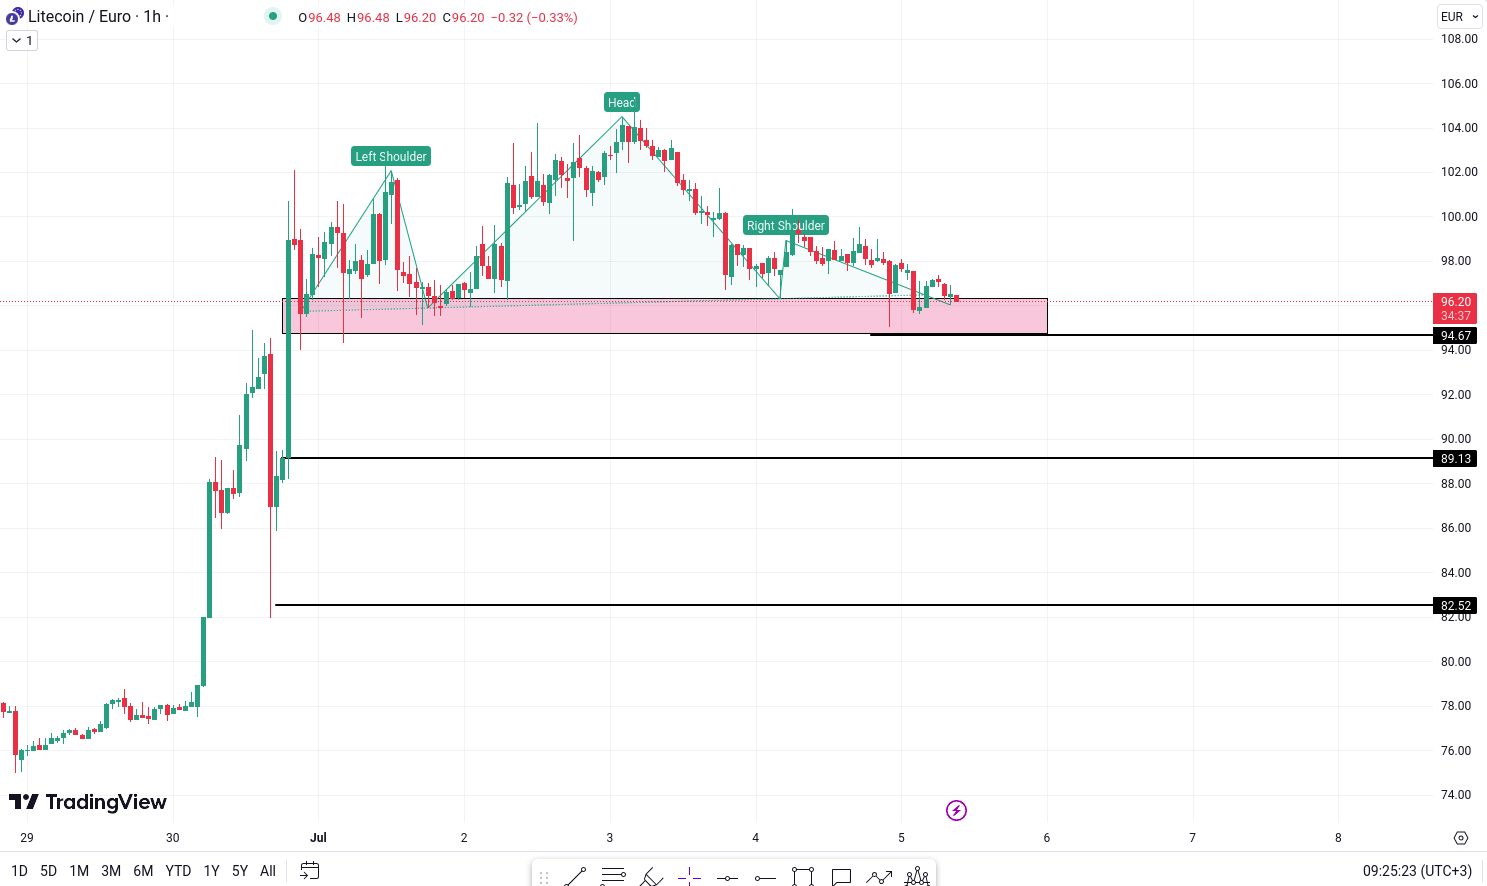
Litecoin (LTC) has garnered significant interest due to the emergence of a potential head and shoulders pattern. This pattern implies that Litecoin’s price has undergone an upward move, followed by a central peak and two subsequent lower peaks. Seasoned investors are closely monitoring the crucial level of 94.67 Euro, as a breach below this level would confirm the pattern and potentially indicate a reversal towards a bearish trend.
Should LTC successfully break below the support level of 94.67 Euro, it would validate the head and shoulders pattern. This breakdown would signify that sellers have taken control and are likely to drive the price lower. In such a scenario, investors may anticipate the following downward targets: 89.13 Euro and 82.52 Euro.
Polkadot (DOT) analysis and update
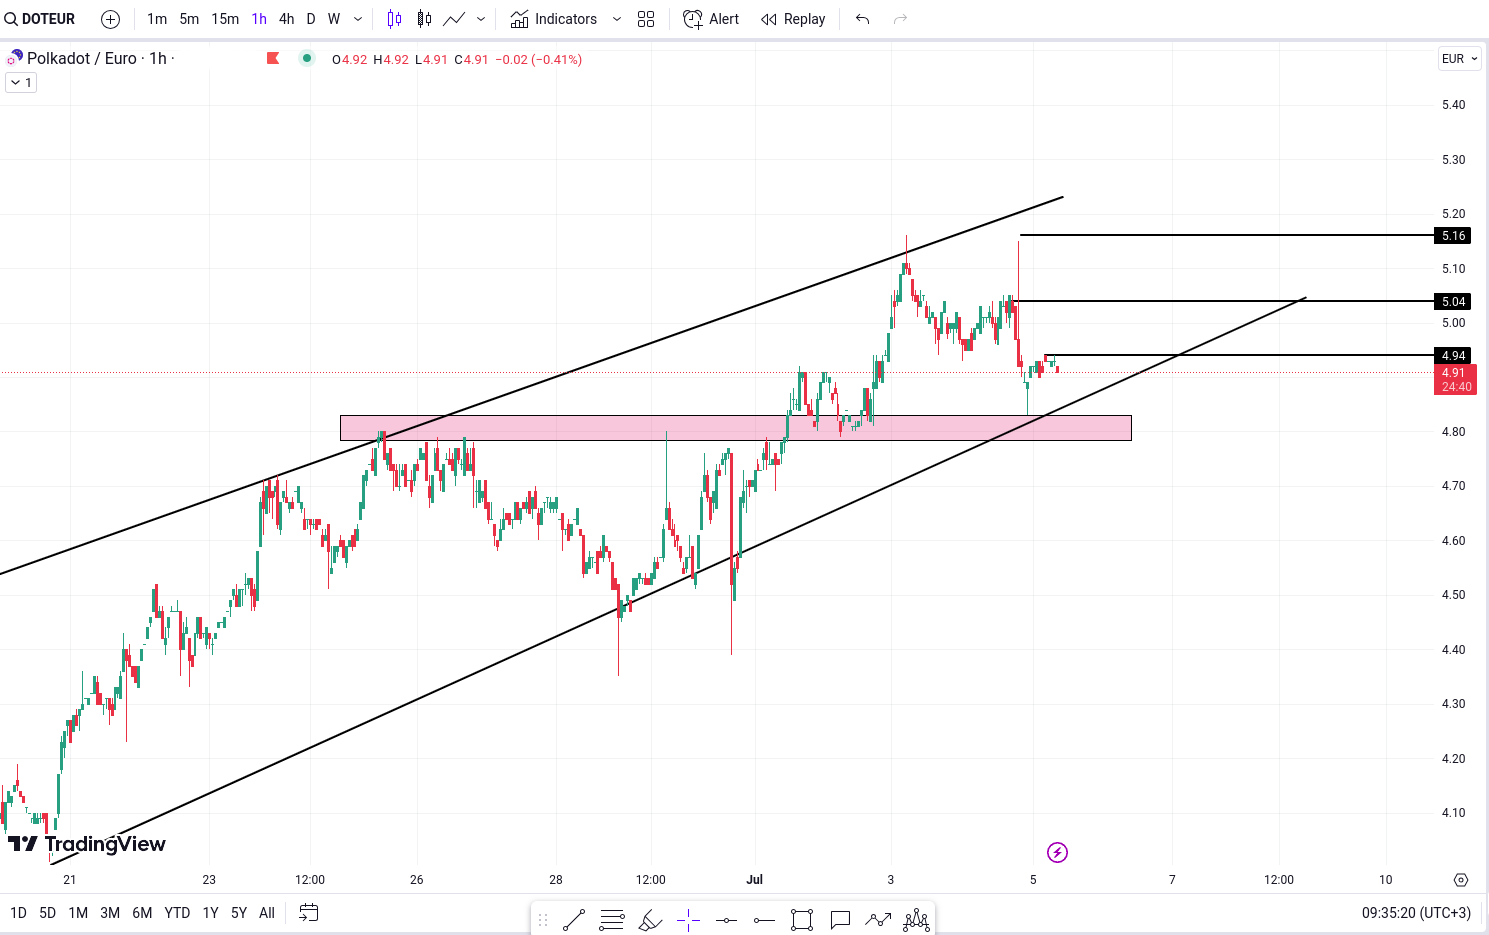
Polkadot has garnered considerable interest among investors due to the emergence of a rising wedge pattern. This pattern indicates that the price of Polkadot has been steadily increasing within the boundaries of the wedge. Traders are currently monitoring the lower trendline, as it represents a potential point of reversal from which the price may attempt to break out and move higher.
If DOT/EUR successfully surpasses the previous high of 4.94 Euro, it would signify that buyers have taken charge and are likely to drive the price further upwards. In such a scenario, traders may anticipate the following targets for potential gains: 5.04 Euro and 5.16 Euro.
AAVE (Aave) update
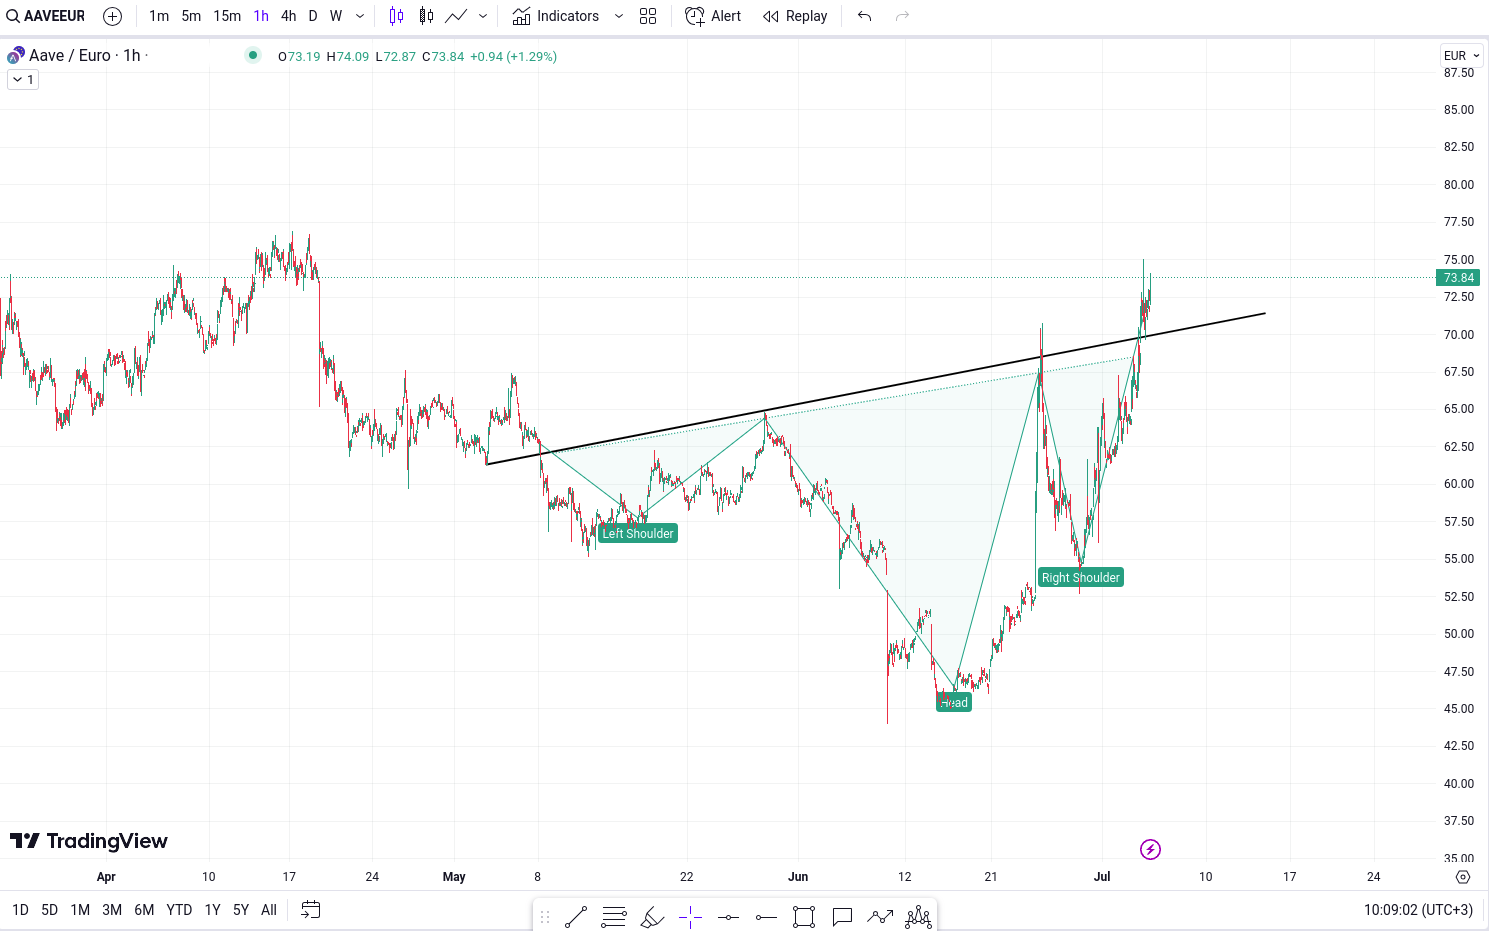
AAVE/EUR is forming an inverse head and shoulder pattern, near to the breakout area.
BNB (BNB) update
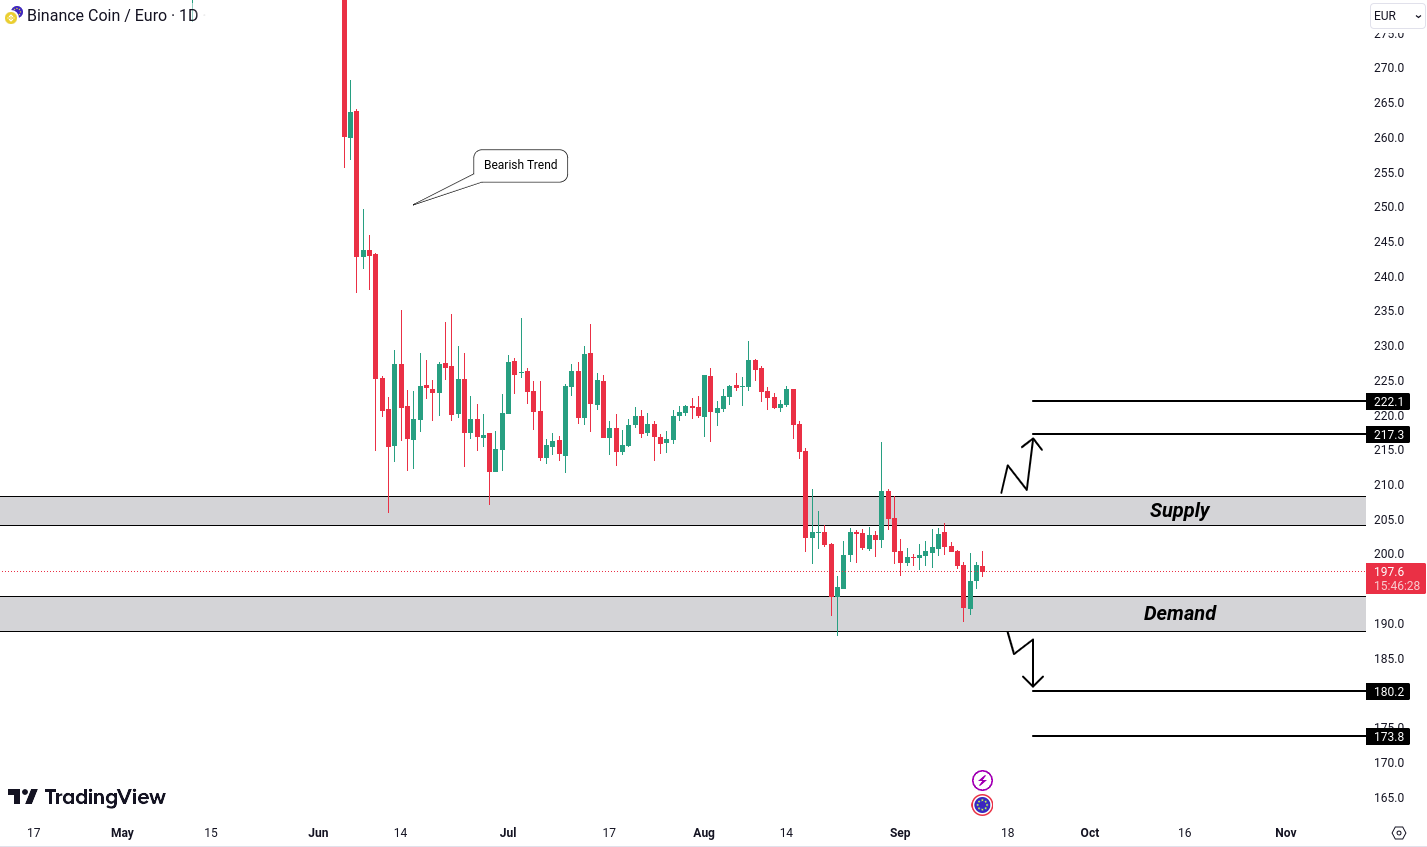
BNB is near to the supply zone.
Limitation of Liability
This report issued by Tradesilvania is purely informative and is not intended to be used as a tool for making investment decisions in crypto-assets. Any person who chooses to use this report in the process of making investment decisions assumes all related risks. Tradesilvania SRL has no legal or other obligation towards the person in question that would derive from the publication of this report publicly.
The content provided on the Tradesilvania website is for informational purposes only and should not be considered as investment advice, financial advice, trading advice, or any other form of advice. We do not endorse or recommend the buying, selling, or holding of any cryptocurrency. It is important that you conduct your own research and consult with a financial advisor before making any investment decisions. We cannot be held responsible for any investment choices made based on the information presented on our website.
The information in this report was obtained from public sources and is considered relevant and reliable within the limits of publicly available data. However, the value of the digital assets referred to in this report fluctuates over time, and past performance does not indicate future growth.
Total or partial reproduction of this report is permitted only by mentioning the source.
