
Market evolution in the last 24h:
🌐 Global cryptocurrency market cap: €980.43B, up 0.89% in the last day.
💰 Total cryptocurrency market volume in the last 24 hours: €25.37B, down 9.21%.
📊 Total volume in DeFi: €1.72B, representing 6.78% of the total cryptocurrency market volume in the last 24 hours.
💵 Volume of all stable coins: €23.74B, representing 93.60% of the total cryptocurrency market volume in the last 24 hours.
👑 Bitcoin dominance: 49.13%, up 0.06% in the last day. 🚀
BTC/EUR Analysis:
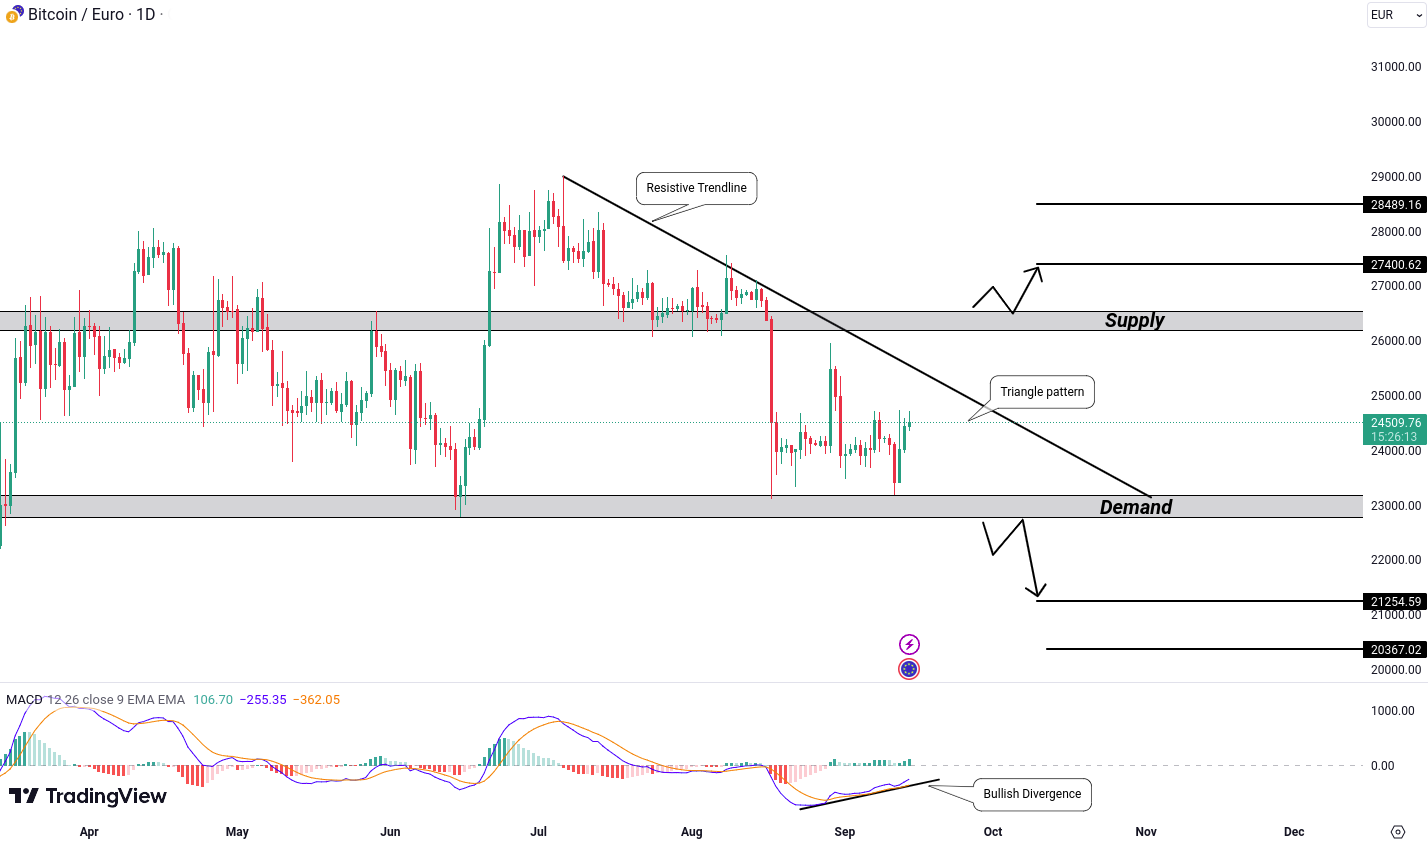
Bitcoin in EUR is showing a triangle pattern on its daily chart. It’s been hanging around a key demand area, indicating a lot of buying happening at this level.
If the price falls below the 22,732 EUR demand area, it could mean a possible downward trend with targets around 21,254 EUR and 20,366 EUR.
On the other hand, for those thinking about an upward trend, the MACD indicator is giving a bullish divergence signal. Also, if we see a breakout above a major resistance trendline, it could suggest an upward trend. But keep in mind, this strategy is riskier and more suitable for seasoned traders.
For those looking for a safer entry point, planning positions above the 26,559 EUR supply level could be a smart move. A breakout here could lead to targets around 27,400 EUR and 28,489 EUR.
ETH/EUR Analysis:
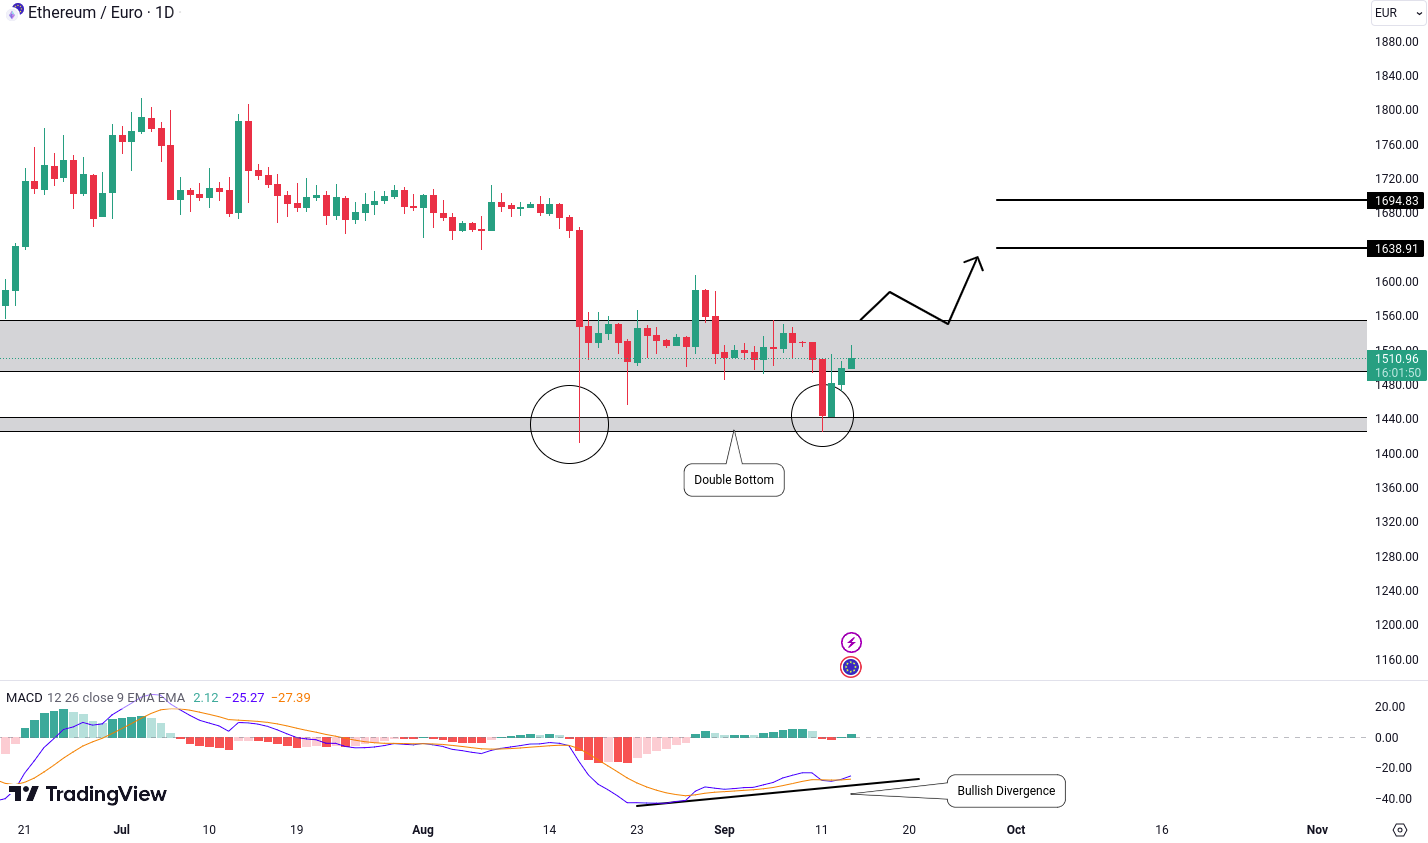
Ethereum in EUR has an interesting setup. Like Bitcoin, it’s also showing a bullish divergence in the MACD indicator. Combined with a double-bottom pattern, this suggests a potential upward swing.
To confirm this sentiment, we’re closely watching the 1,553 EUR level. A clear breakout above this could lead to bullish targets around 1,638 EUR and 1,694 EUR. This presents an enticing opportunity for traders in the upcoming sessions.
EGLD/EUR Analysis:
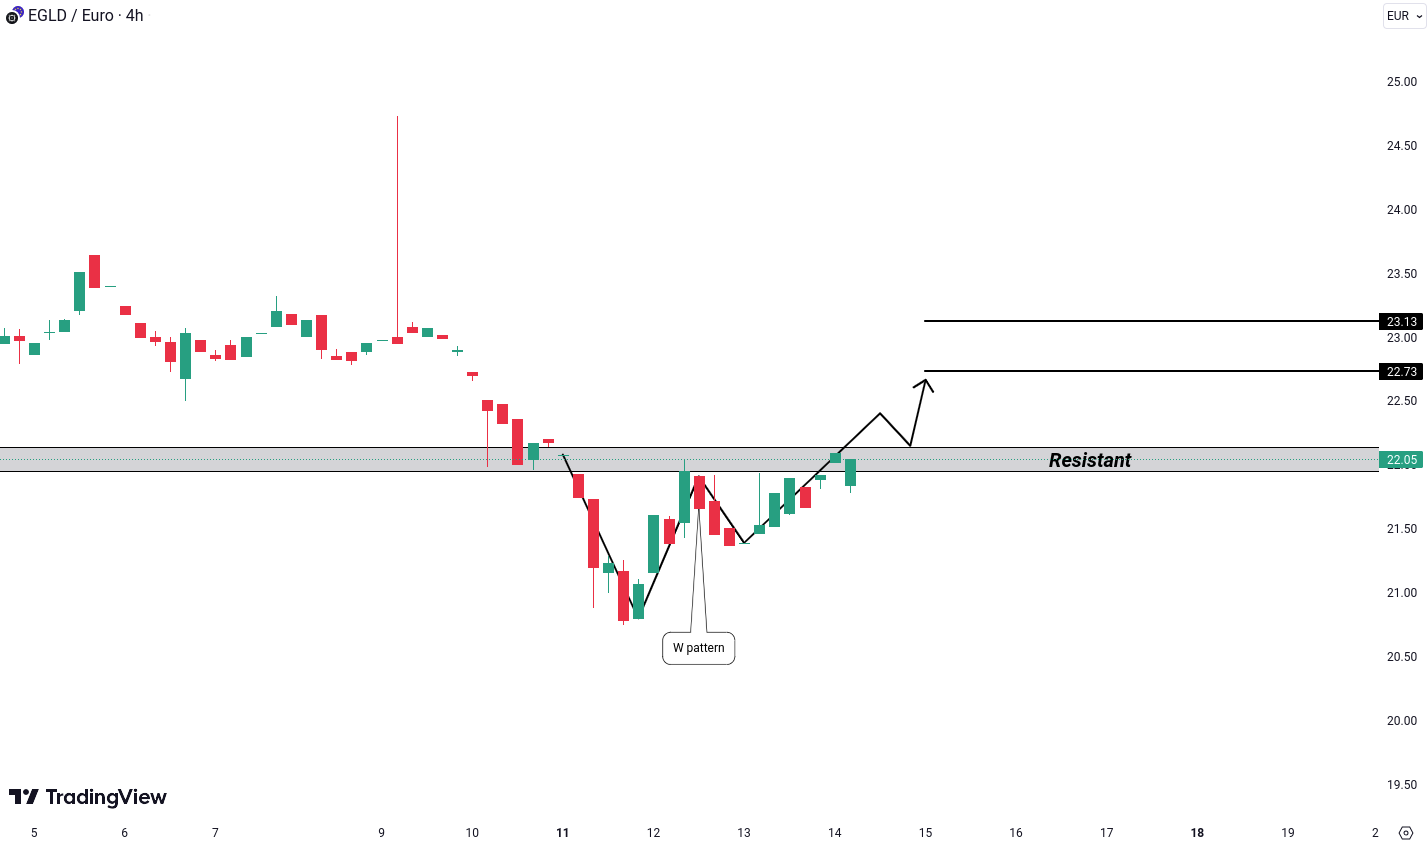
EGLD is forming a W pattern over a 4-hour timeframe. If the price breaks the 22.22 resistance level, we can expect an upward trend, with potential targets of 22.73 and 23.13.
Remember that W patterns are often seen as signals of possible trend reversals, especially when they form at the bottom of an existing trend. Given the overall bullish sentiment in the market, this breakout opportunity could be quite appealing for traders considering a long position.
BNB/EUR Analysis:
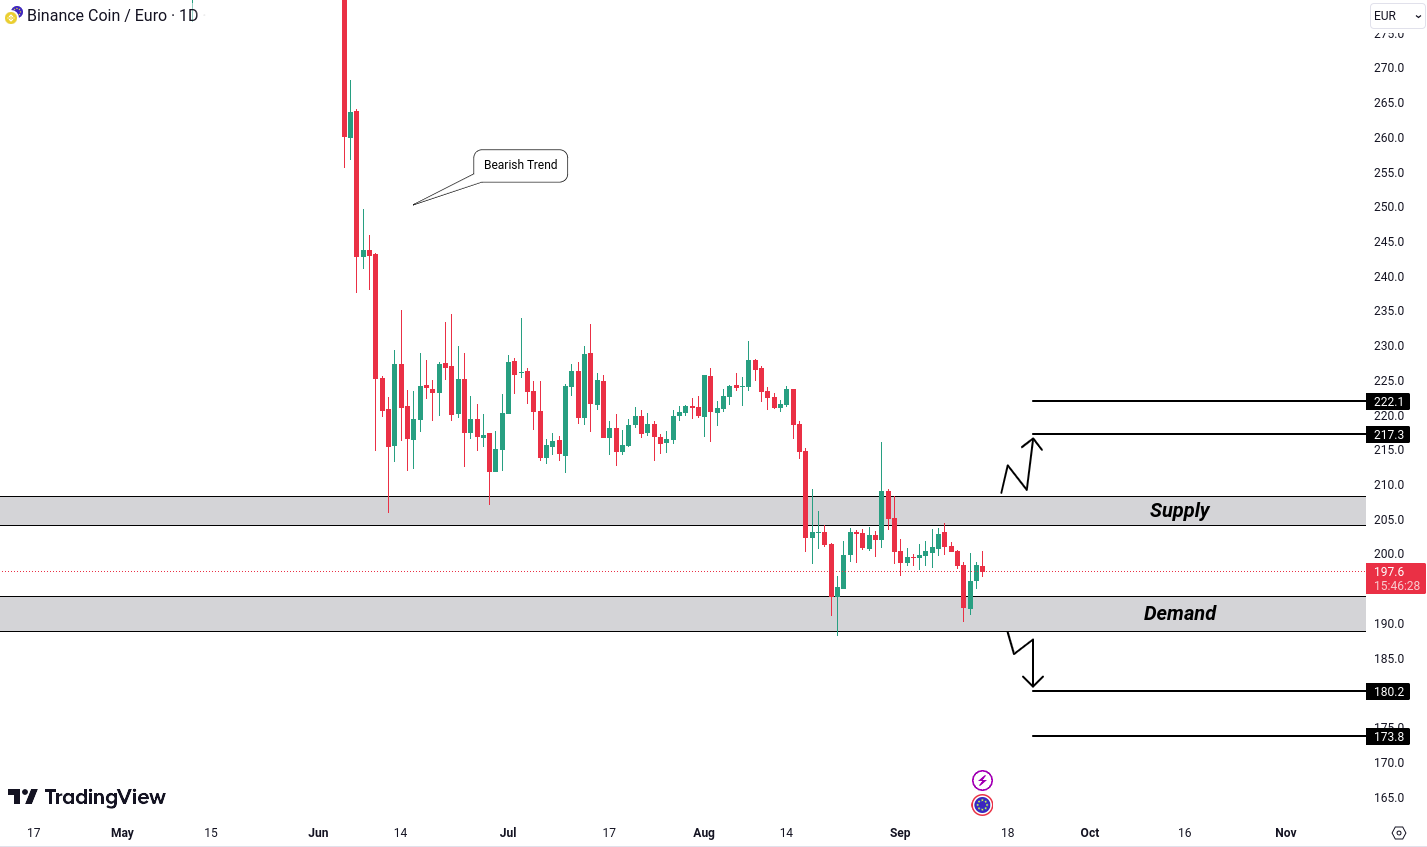
Binance Coin in EUR is currently in a consolidation phase, trading within demand and supply areas. This suggests that many retail traders are entering positions without a clear strategy, often swayed by emotions rather than rational decisions.
When the price eventually breaks out of either the demand or supply area, it can trigger a strong directional move. This usually happens as traders’ stop-loss orders get hit, adding momentum to the move.
For a bullish scenario, we should look for a breakout above the 209 EUR resistance area. If this happens, potential targets could be around 217.3 EUR and 222.1 EUR.
Conversely, if a downward trend emerges, we should watch for a breakdown below the 188.1 EUR demand area. In this case, potential targets might be at 180.2 EUR and 173.8 EUR.
AXS/EUR Analysis:
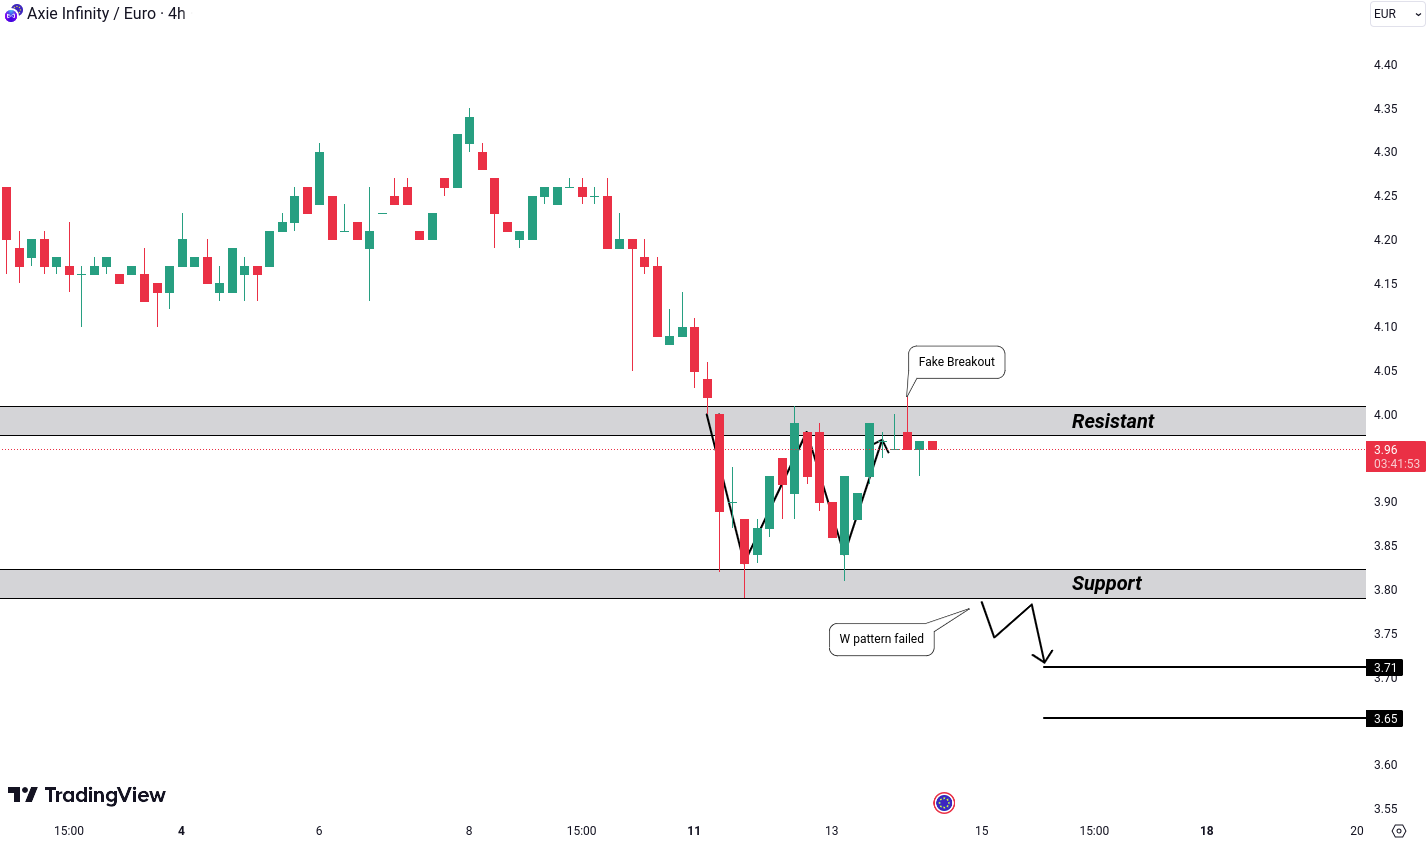
Axie Infinity in EUR serves as a reminder that things aren’t always what they seem. At first glance, it looked like a W pattern breakout was underway, hinting at a possible upward trend. However, seasoned traders know to expect surprises from the market.
Those who entered long positions likely placed their stop-loss orders just below the demand area or the low point of the W pattern. This strategy carries some risk as an unexpected price turn could trigger these stop-loss orders.
Traders preferring a safer strategy might choose to wait for a breakdown below the low of the W pattern at 3.78 EUR. This will help capture any downward move triggered by stop-loss orders. In such a scenario, our expected targets are around 3.71 EUR and 3.65 EUR.
Limitation of Liability
This report issued by Tradesilvania is purely informative and is not intended to be used as a tool for making investment decisions in crypto-assets. Any person who chooses to use this report in the process of making investment decisions assumes all related risks. Tradesilvania SRL has no legal or other obligation towards the person in question that would derive from the publication of this report publicly.
The content provided on the Tradesilvania website is for informational purposes only and should not be considered as investment advice, financial advice, trading advice, or any other form of advice. We do not endorse or recommend the buying, selling, or holding of any cryptocurrency. It is important that you conduct your own research and consult with a financial advisor before making any investment decisions. We cannot be held responsible for any investment choices made based on the information presented on our website.
The information in this report was obtained from public sources and is considered relevant and reliable within the limits of publicly available data. However, the value of the digital assets referred to in this report fluctuates over time, and past performance does not indicate future growth.
Total or partial reproduction of this report is permitted only by mentioning the source.
