Crypto Market update and BTC, ETH, EGLD, DOT and AXS analysis - 2 October 2023

Crypto Market in the last 24h:
🌐 Global crypto market cap: €1.04T (-1.87%)
📊 Total 24-hour crypto market volume: €41.72M (+25.88%)
💼 DeFi volume: €3.17M (7.59% of total)
💰 Stablecoins volume: €39.1M (93.72% of total)
₿ Bitcoin dominance: 49.38% (+0.14%)
Bitcoin (BTC/EUR)
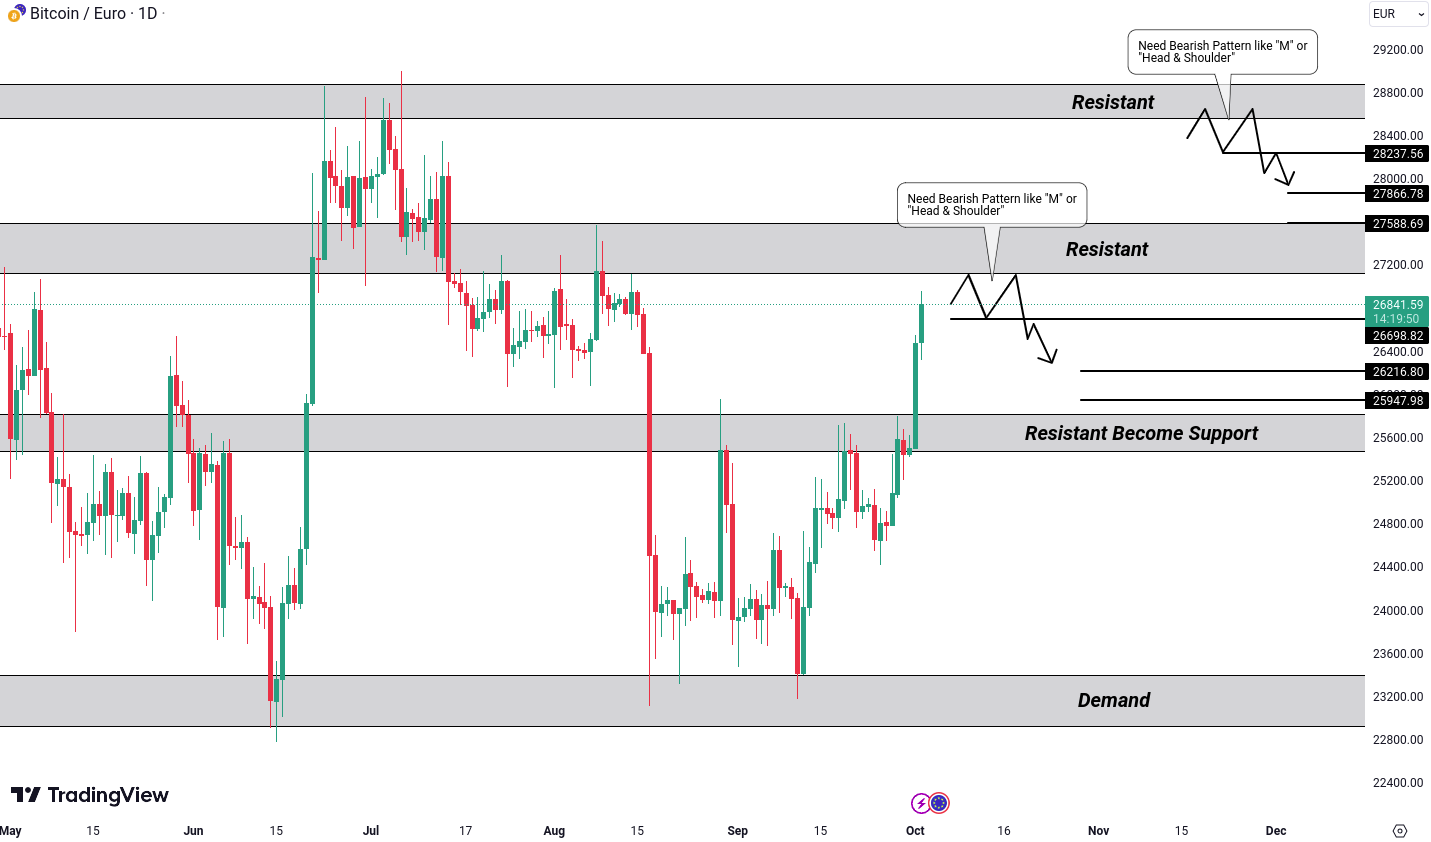
BTC/EUR is currently exhibiting a falling knife-like scenario. In such situations, it's advisable to proceed cautiously and seek opportunities at specific levels.
The price is consolidating near a significant resistance area at €27,247. In situations like this, it's crucial to watch out for the formation of patterns such as the 'M' pattern or the head and shoulders pattern. If one of these patterns forms, it could present a shorting opportunity.
For a short position, we would require a breakdown below €26,698. If this occurs, it could lead to targets of approximately €26,216 and €25,947.
On the other hand, if the resistance at €27,247 is breached, our attention will shift to the next resistance level at €28,602. Once again, we'll be vigilant for the M pattern or head and shoulders pattern. To validate a short position in this scenario, a breakdown below €28,237 would be needed, potentially leading to targets of €27,866 and €27,588.
Remember, patience and strategic analysis are key in trading, especially in dynamic situations like this one.
Ethereum (ETH/EUR)
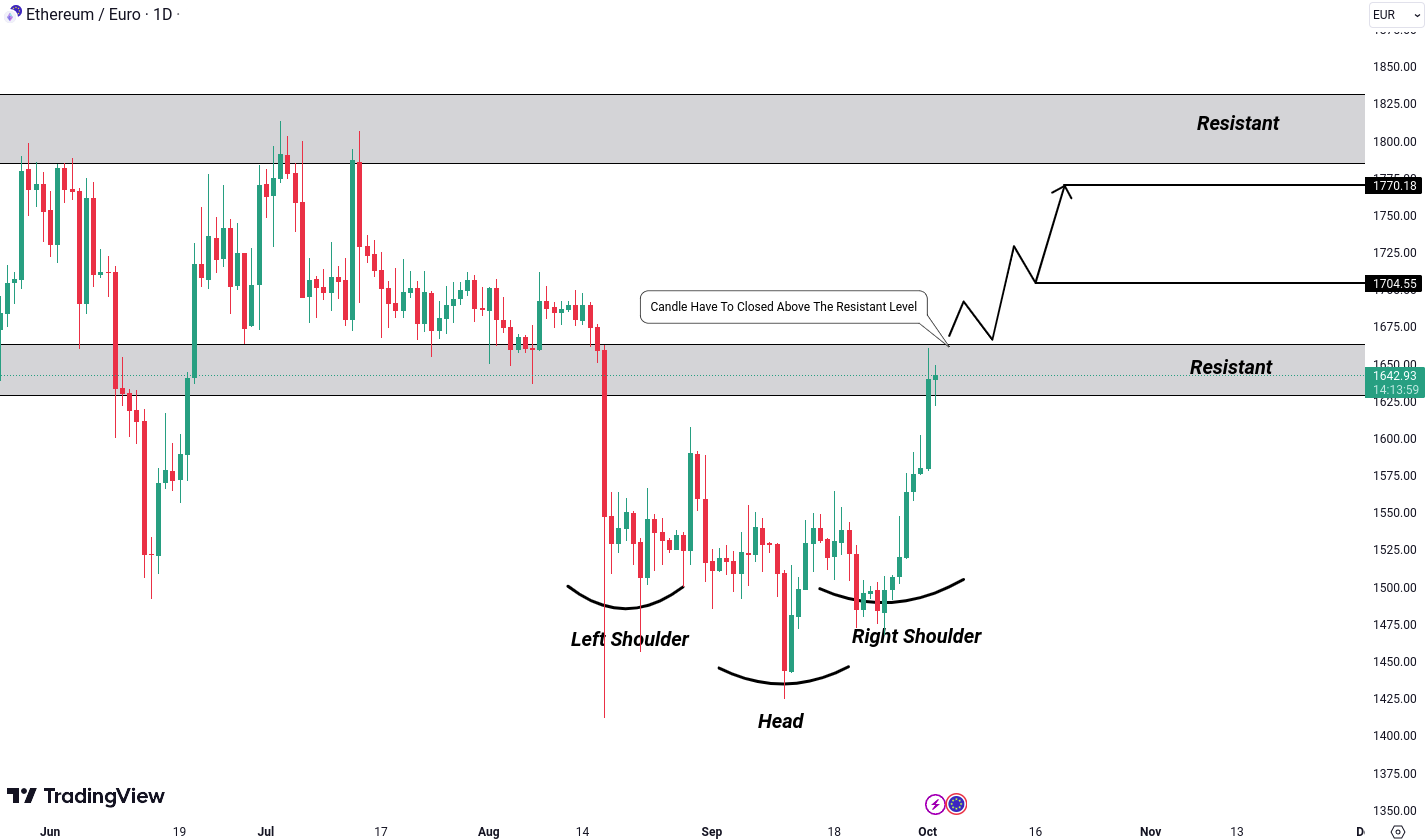
ETH/EUR has formed an inverse head and shoulders pattern and is currently hovering around a crucial resistance level. If the market manages to break above the €1,663 level, it could open the door to potential targets around €1,704. Furthermore, if this level is breached, we might observe a second target at €1,770.
This pattern suggests a potential shift in market sentiment, but as always, it's wise to monitor the breakout and closely follow price action before making any trading decisions.
MultiversX (EGLD/EUR)
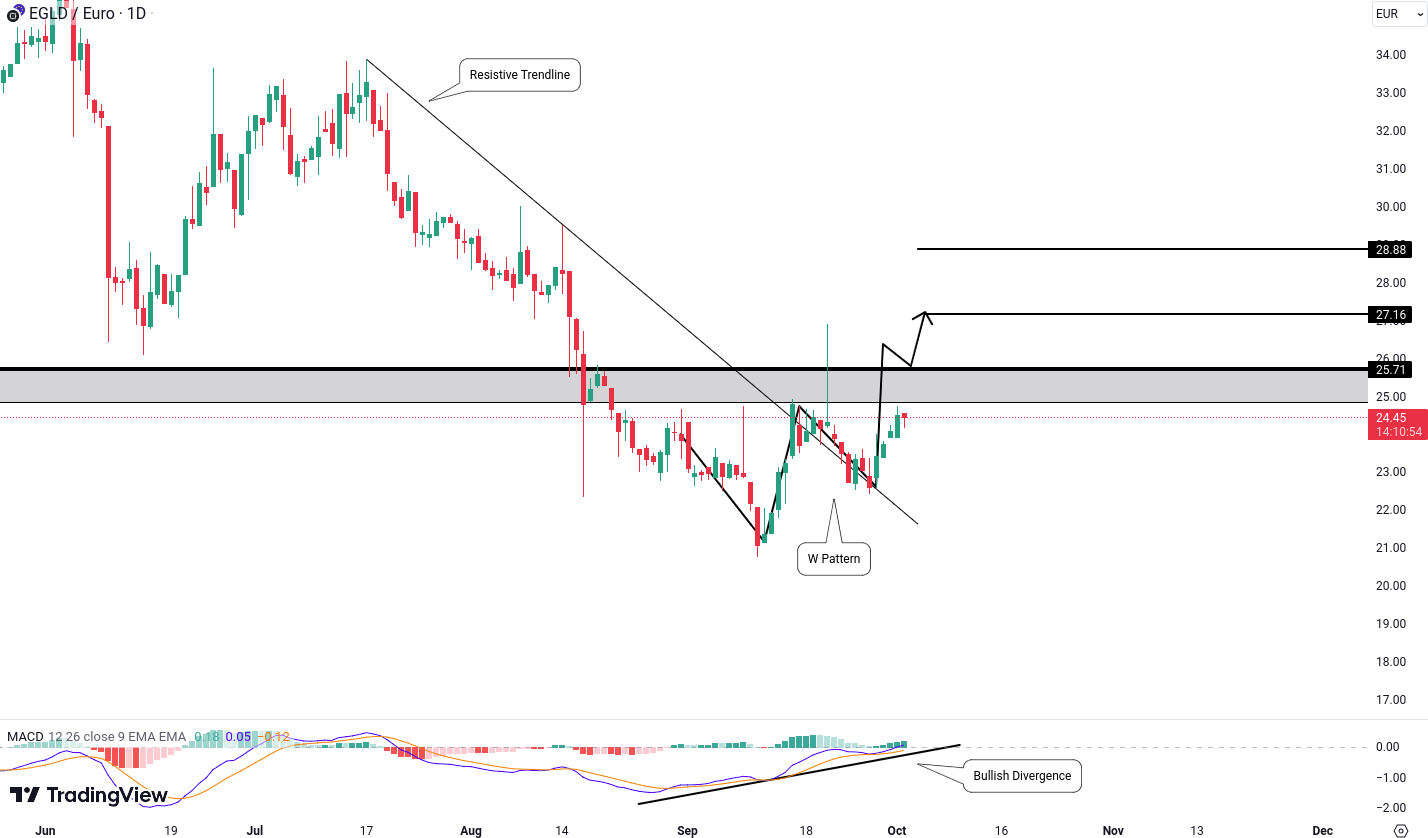
EGLD/EUR is currently in an interesting phase. It has broken out of a resistive trendline and is forming a W pattern. Additionally, there's a bullish divergence in the MACD indicator, which enhances the confidence of the bulls.
However, for confirmation of this potential bullish move, we're closely monitoring the €25.71 level. If the price manages to break above this level, it could pave the way for targets around €27.16 and €28.88.
Axie Infinity (AXS/EUR)
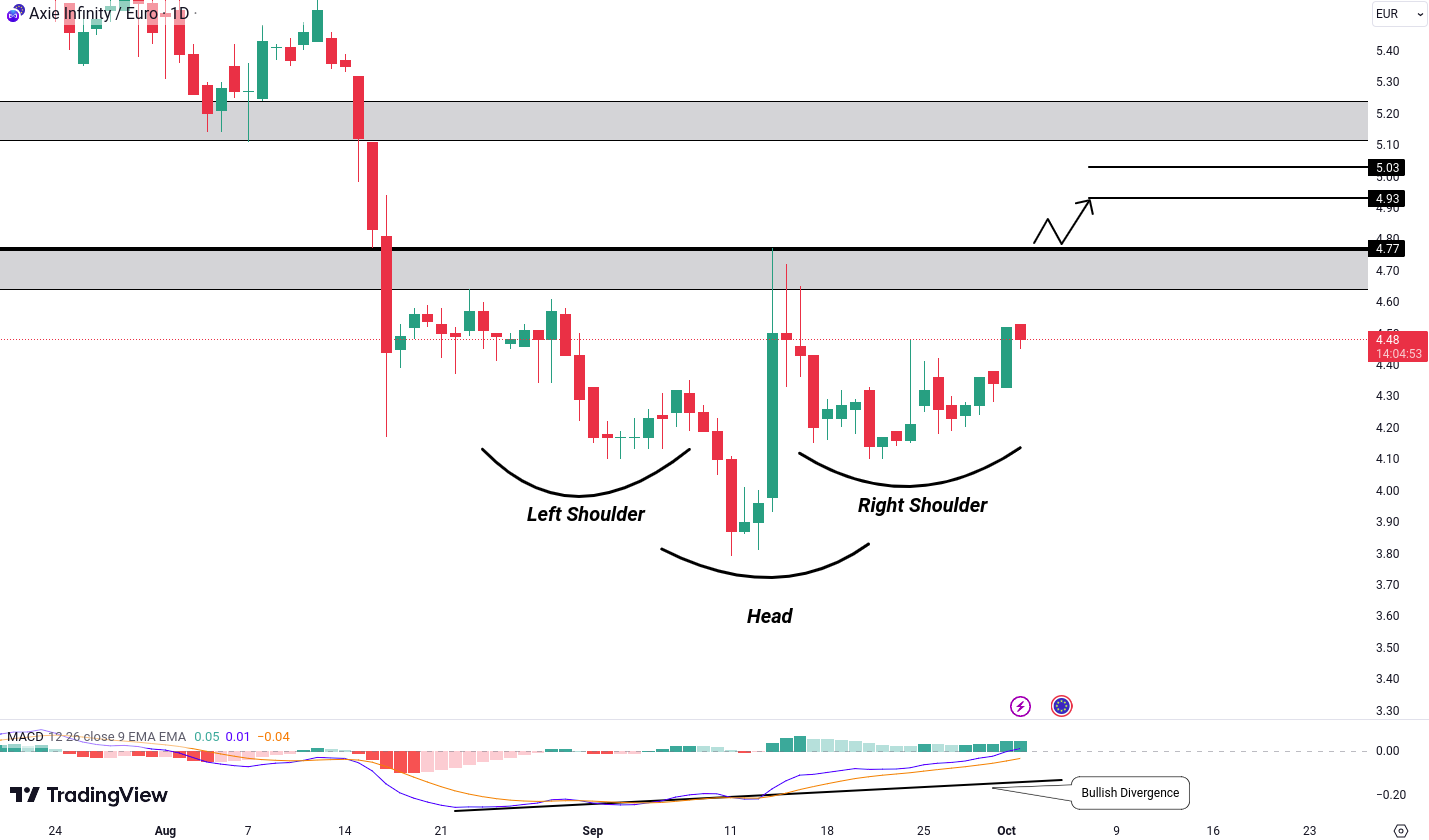
AXS/EUR is currently displaying signs of a potential bullish move. It's forming an inverse head and shoulder pattern, and there's a bullish divergence in the MACD indicator, adding to the positive outlook on the daily chart.
To confirm this bullish scenario, we'll be closely watching the €4.77 level. If the price manages to break above this level, it could open the door to targets around €4.93 and €5.03.
These patterns and indicators suggest a favorable setup for bullish traders, but, as always, it's wise to await breakout confirmation before considering any trading positions.
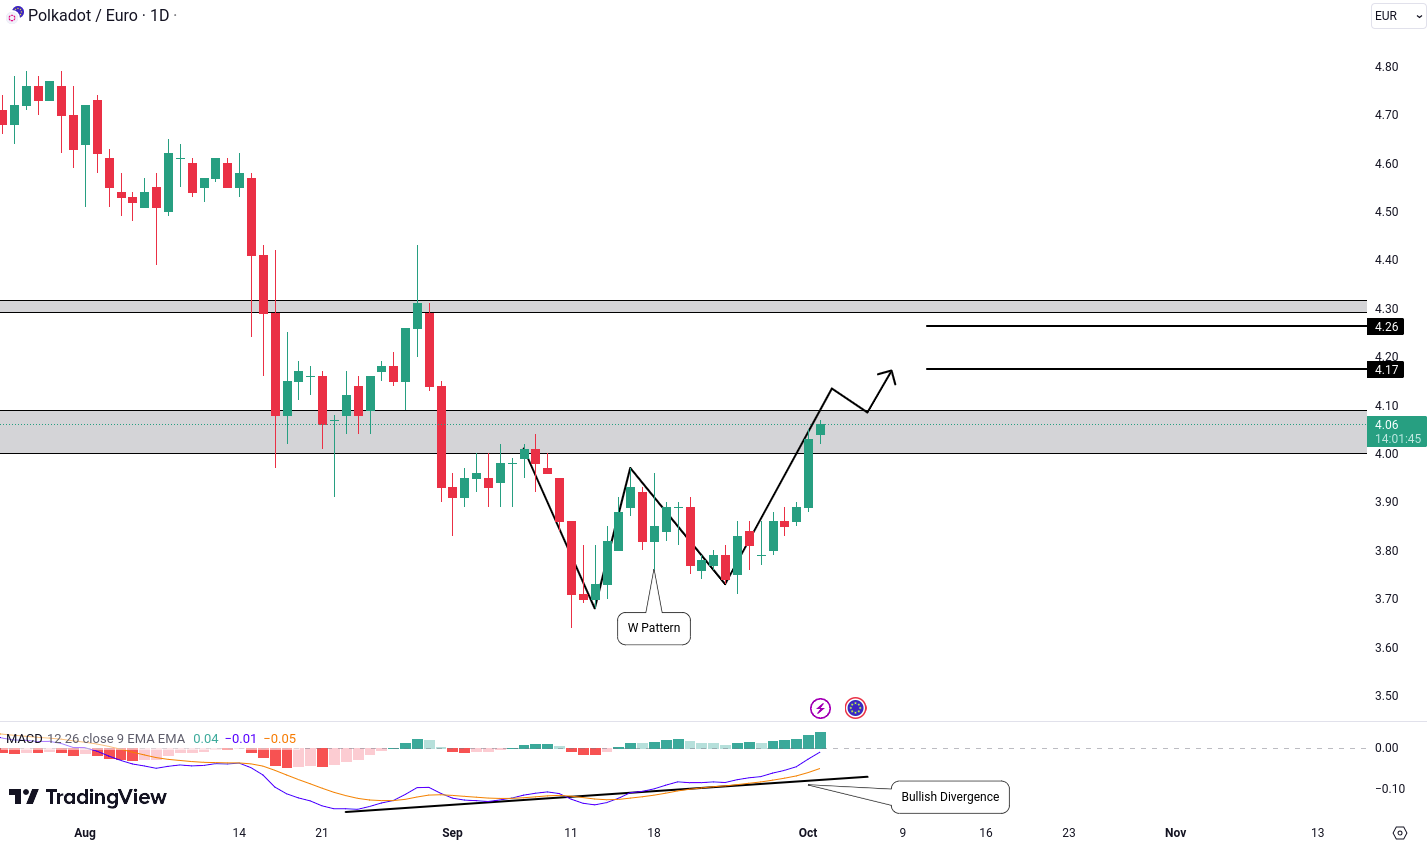
Polkadot (DOT/EUR)
DOT/EUR appears to be showing promise for a potential bullish movement. It's forming a W pattern, and the MACD indicator is displaying a bullish divergence, often seen as a positive sign for bulls.
To confirm this potential bullish scenario, we'll keep a close eye on the €4.09 level. After a breakout, we can anticipate targets of €4.17 and €4.26.
