Crypto analysis for BTC, ETH, EGLD, AAVE and SOL - May 19, 2025

Crypto market in the last 24h:
🌐 Global Market Cap: $3.24T (-1.89%)
📊 24h Volume: $151.74B (+82.56%)
💰 DeFi Volume: $35.16B (23.16% of total volume)
🔒 Stablecoins Volume: $143.64B (94.66% of total volume)
💵 Bitcoin Dominance: 62.9% (-0.06%)
Bitcoin (BTC) Analysis
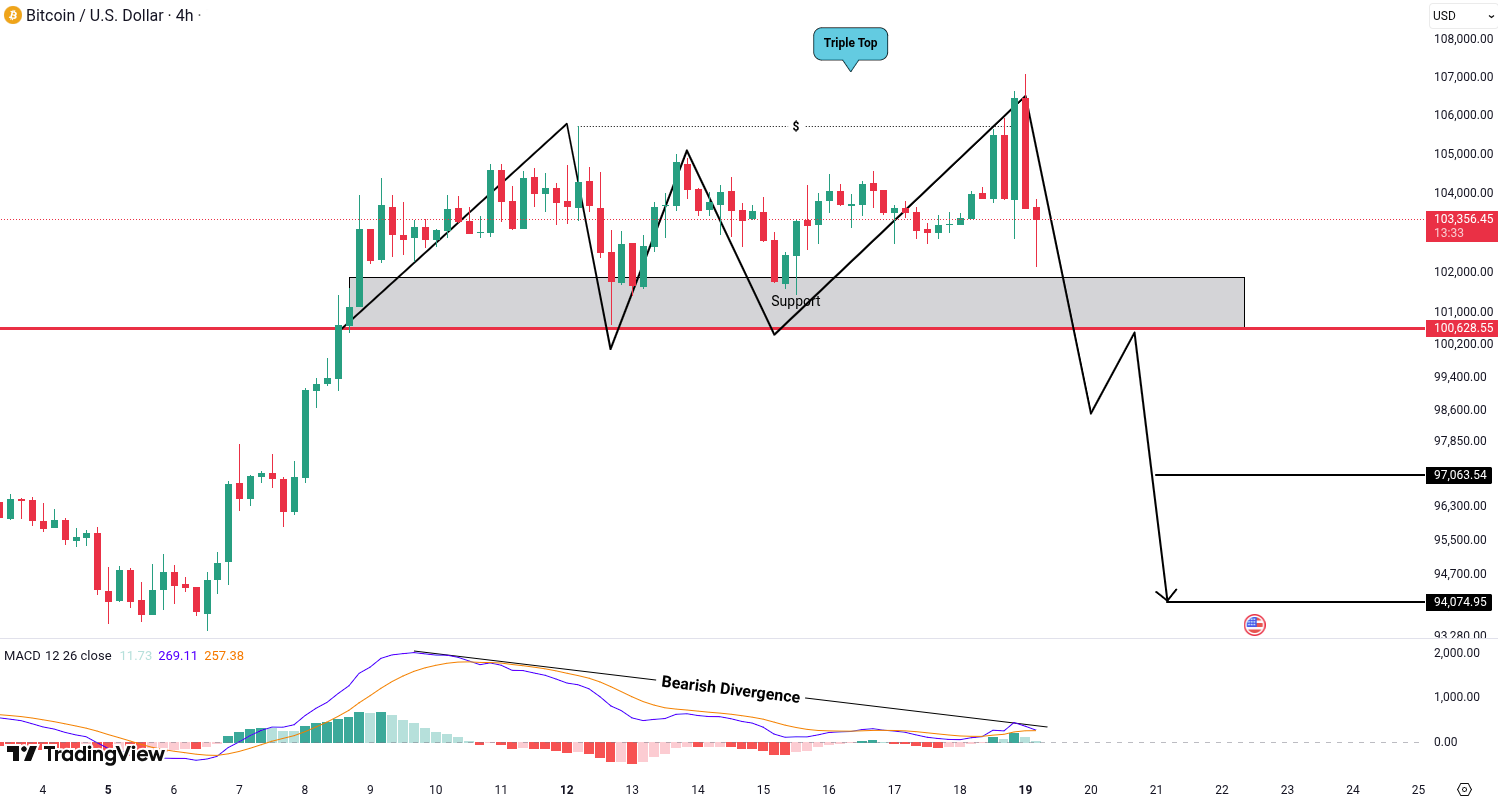
BTC is showing clear signs of a buyer trap and has formed a triple top pattern along with bearish divergence. These two signals increase the probability of a bearish move.
However, for confirmation, we need a breakdown and candle closing below the support zone of 100,628 USD. If that level breaks, the next potential targets are around 98,094 USD and 95,880 USD, based on the measured move of the pattern and previous support zones.
Ethereum (ETH) Analysis
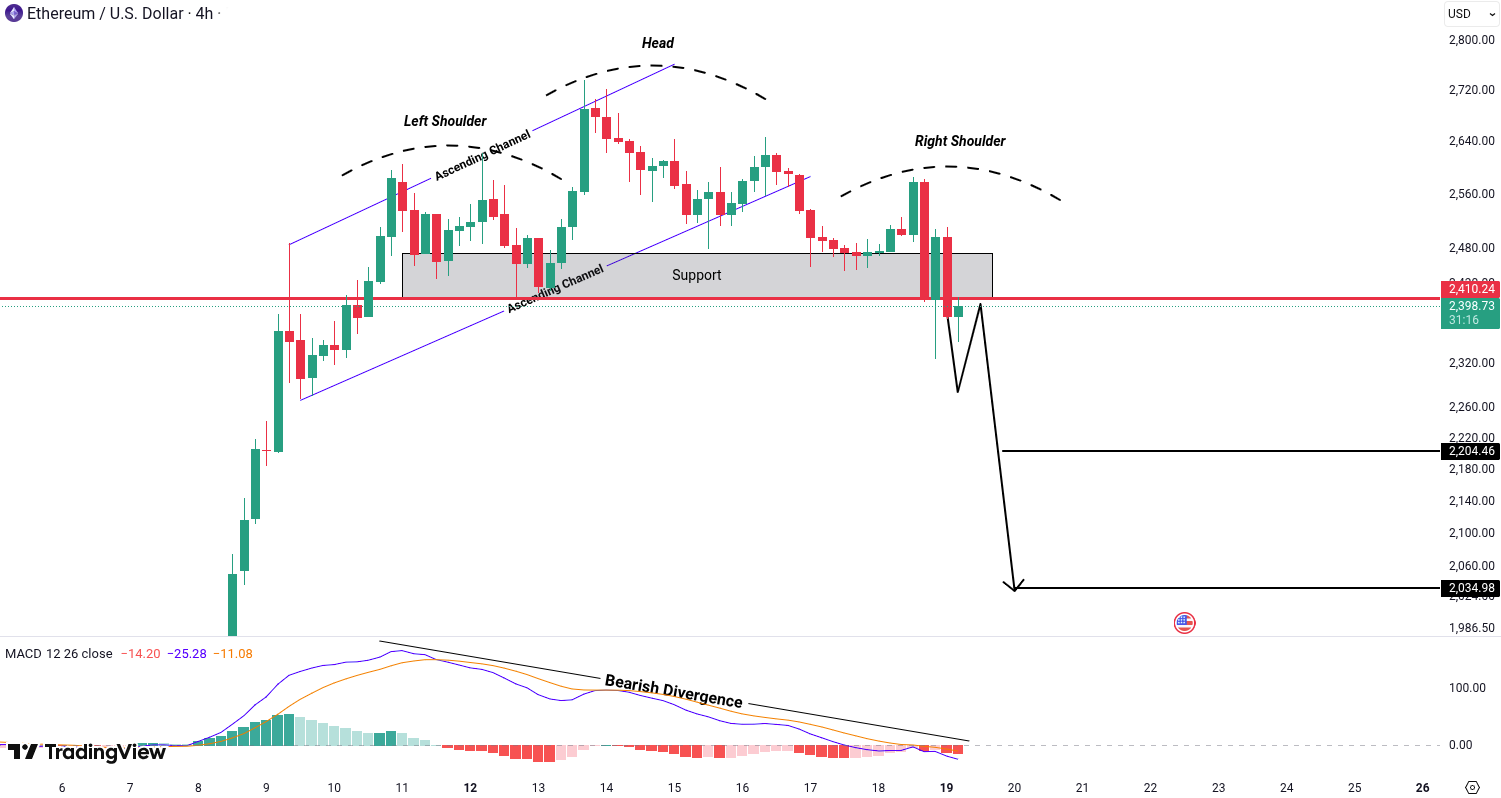
ETH has broken down from an ascending channel and has also formed a head and shoulders pattern, accompanied by bearish divergence. This combination of technical signals significantly increases the probability of a bearish move. The breakdown from the ascending channel indicates a loss of bullish momentum, and the head and shoulders is a classic reversal pattern, especially when supported by weakening momentum through bearish divergence.
To confirm the bearish scenario, we need to see a breakdown and a strong candle closing below the key support at 2,410 USD. If this happens, it validates the pattern and opens the way for further downside. The first level to watch is around 2,204 USD as intermediate support. If the selling continues, the next target is near 2,034 USD, in line with deeper support from previous price structure.
MultiversX (EGLD) Analysis
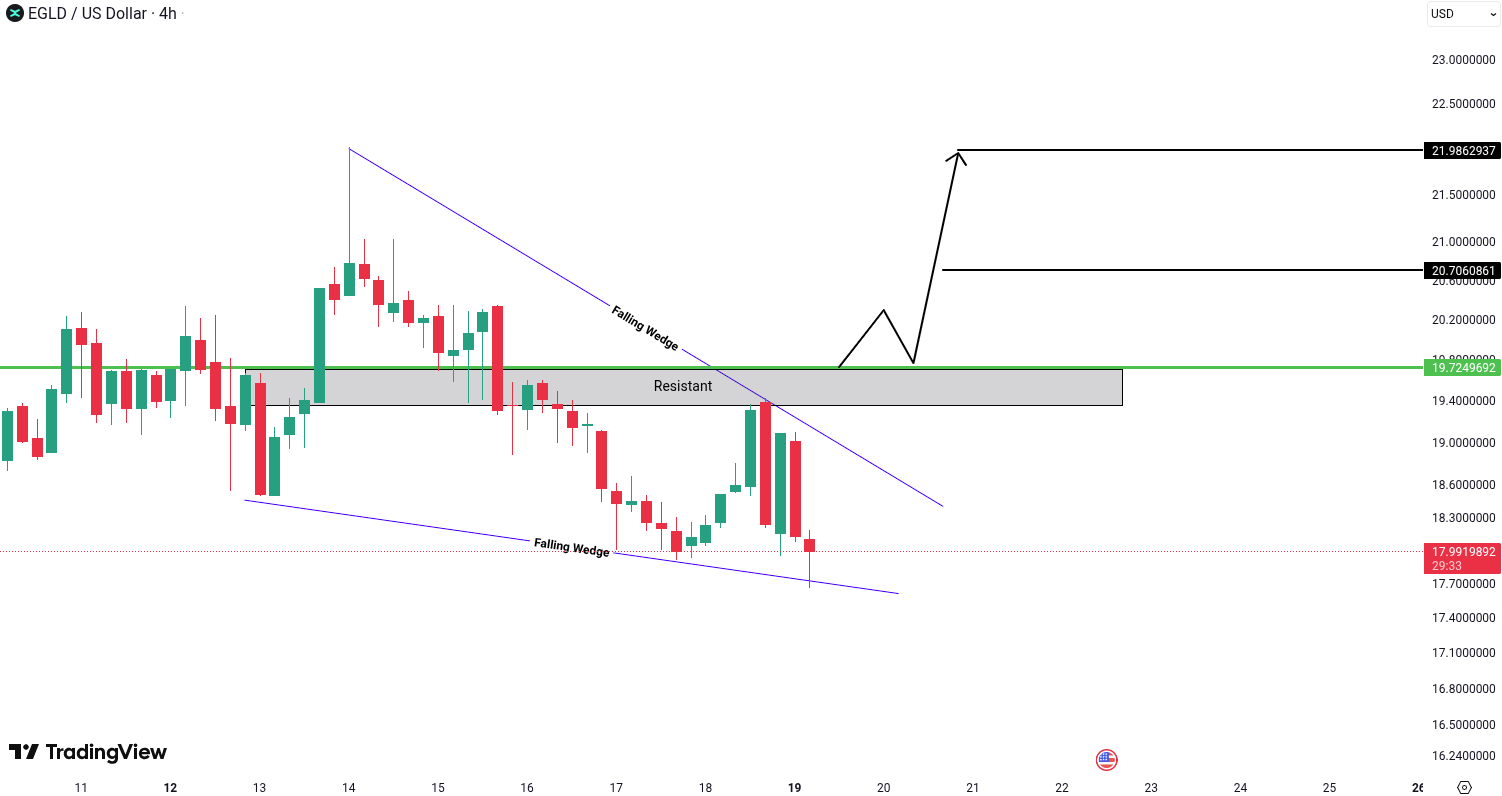
EGLD has formed a falling wedge pattern, which increases the probability of a bullish move. For confirmation, we need a breakout and candle closing above the resistance zone at 19.72 USD. If that happens, the next targets would be 20.70 USD and 21.98 USD.
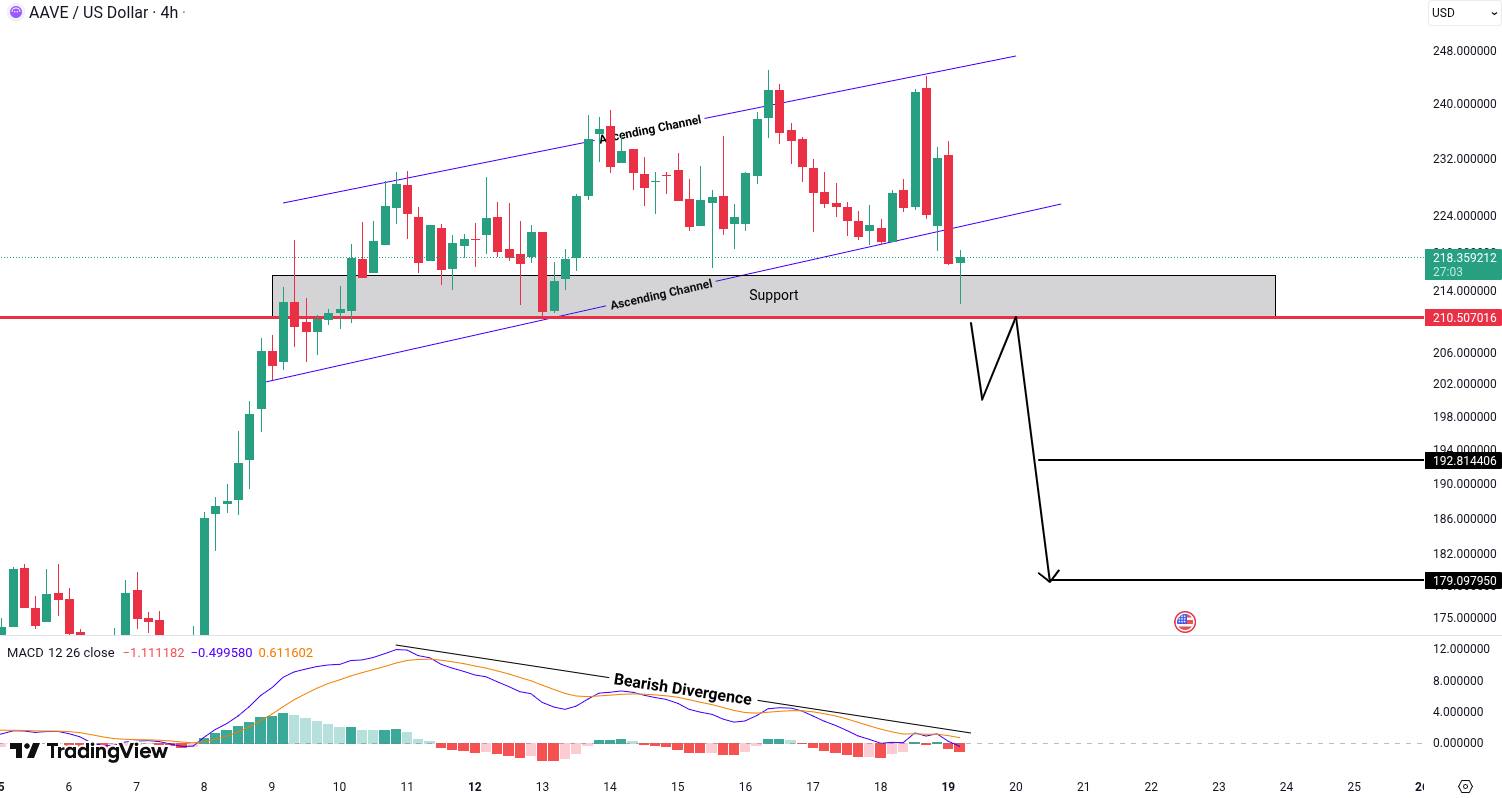
Aave (AAVE) Analysis
AAVE has formed an ascending channel with bearish divergence, which increases the likelihood of a bearish move. Confirmation requires a breakdown and candle closing below the 210.50 USD support level. If that occurs, we can expect downside targets of 192.81 USD and 179.09 USD. The ascending channel often signals a potential trend reversal when it forms after a bullish move, especially with weakening momentum.
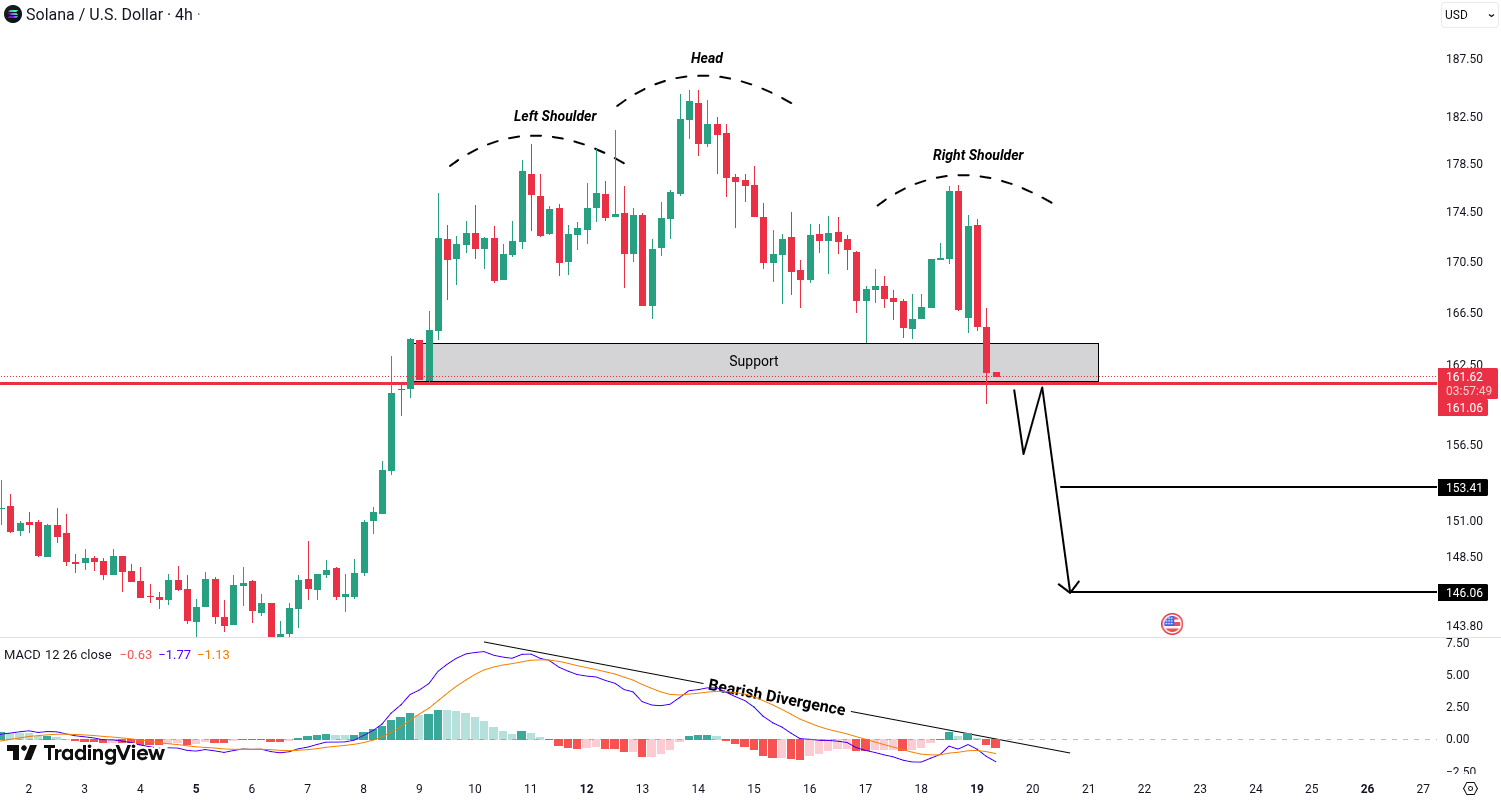
Solana (SOL) Analysis
SOL has formed a head and shoulders pattern with bearish divergence, which increases the probability of a bearish move. For confirmation, we need a breakdown and candle closing below the support at 161.53 USD. If that level breaks, it could lead to a drop toward 153.41 USD and 146.06 USD. The head and shoulders is a well-known reversal structure that typically signals a shift from bullish to bearish momentum.
All cryptocurrencies are available for trading on Tradesilvania , and their prices can be seen on the Tradesilvania price page, accessible through the following link: https://tradesilvania.com/en/prices
With the help of our platform, you can deposit, withdraw, buy or sell any of these cryptocurrencies using the free digital wallet. SEPA Top-up (On-Ramp & Off-Ramp) Euro and RON instant transfers and over 100 cryptocurrencies, are all available in our app.
Limitation of Liability
This report issued by Tradesilvania is purely informative and is not intended to be used as a tool for making investment decisions in crypto-assets. Any person who chooses to use this report in the process of making investment decisions assumes all related risks. Tradesilvania SRL has no legal or other obligation towards the person in question that would derive from the publication of this report publicly.
The content provided on the Tradesilvania website is for informational purposes only and should not be considered as investment advice, financial advice, trading advice, or any other form of advice. We do not endorse or recommend the buying, selling, or holding of any cryptocurrency. It is important that you conduct your own research and consult with a financial advisor before making any investment decisions. We cannot be held responsible for any investment choices made based on the information presented on our website.
The information in this report was obtained from public sources and is considered relevant and reliable within the limits of publicly available data. However, the value of the digital assets referred to in this report fluctuates over time, and past performance does not indicate future growth.