Crypto analysis for BTC, ETH, EGLD, AVAX and SOL - April 17, 2025

Crypto market in the last 24h:
🌐 Global market cap: $2.66T (+0.75%)
📊 Total 24h volume: $75.68B (-1.17%)
💰 DeFi volume: $6.43B (8.49% of total volume)
🔒 Stablecoins volume: $69.72B (92.12% of total volume)
💵 Bitcoin dominance: 63.02% (-0.06%)
Bitcoin (BTC) Analysis
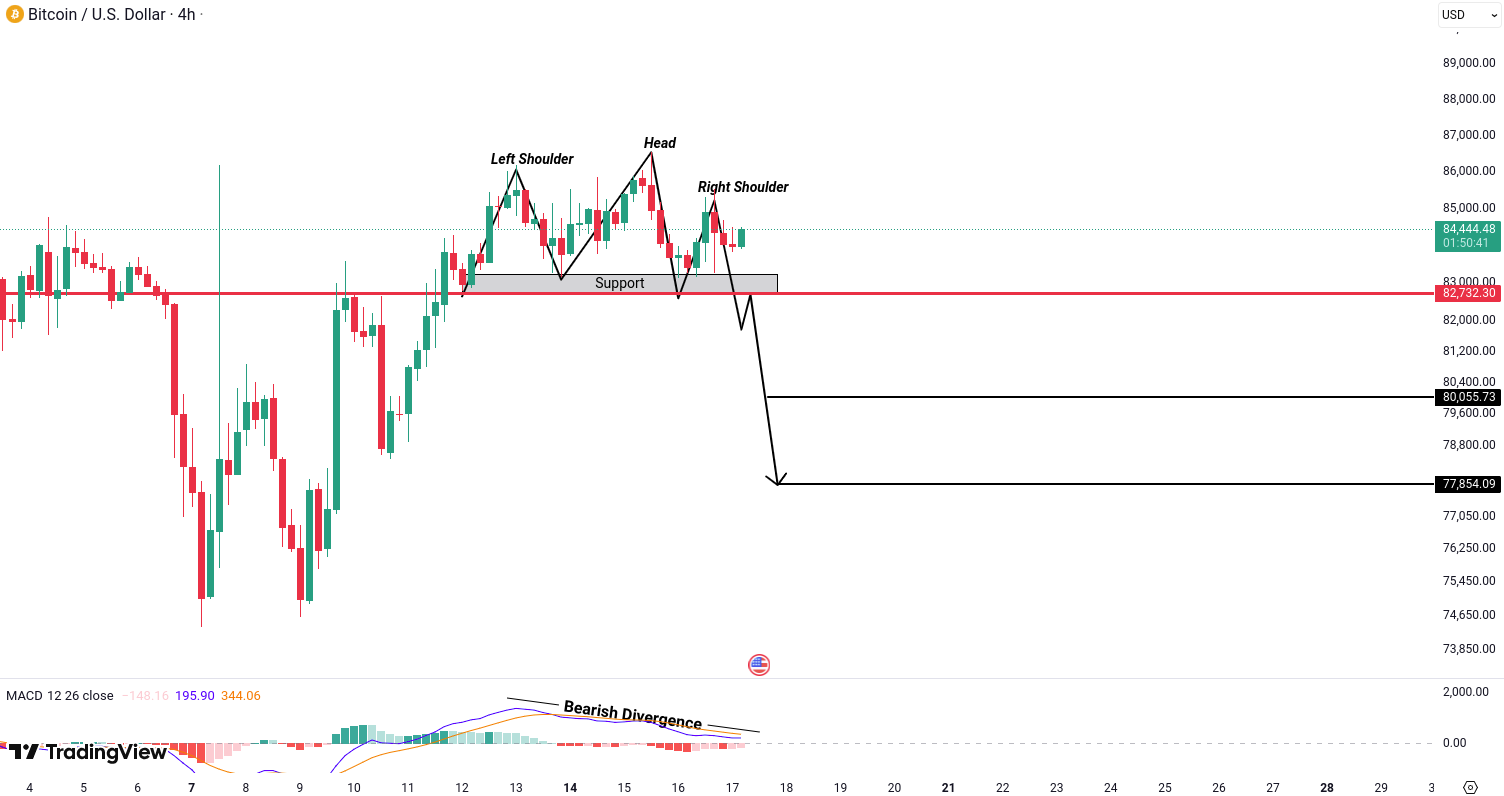
Bitcoin (BTC) is showing bearish potential as it has formed a head and shoulders pattern along with bearish divergence. This combination increases the likelihood of a downward move. However, for confirmation, we need a breakdown and candle closing below the support zone at 82,732. If this breakdown occurs, the next potential downside targets are 80,055 and 77,854 USD.
Ethereum (ETH) Analysis
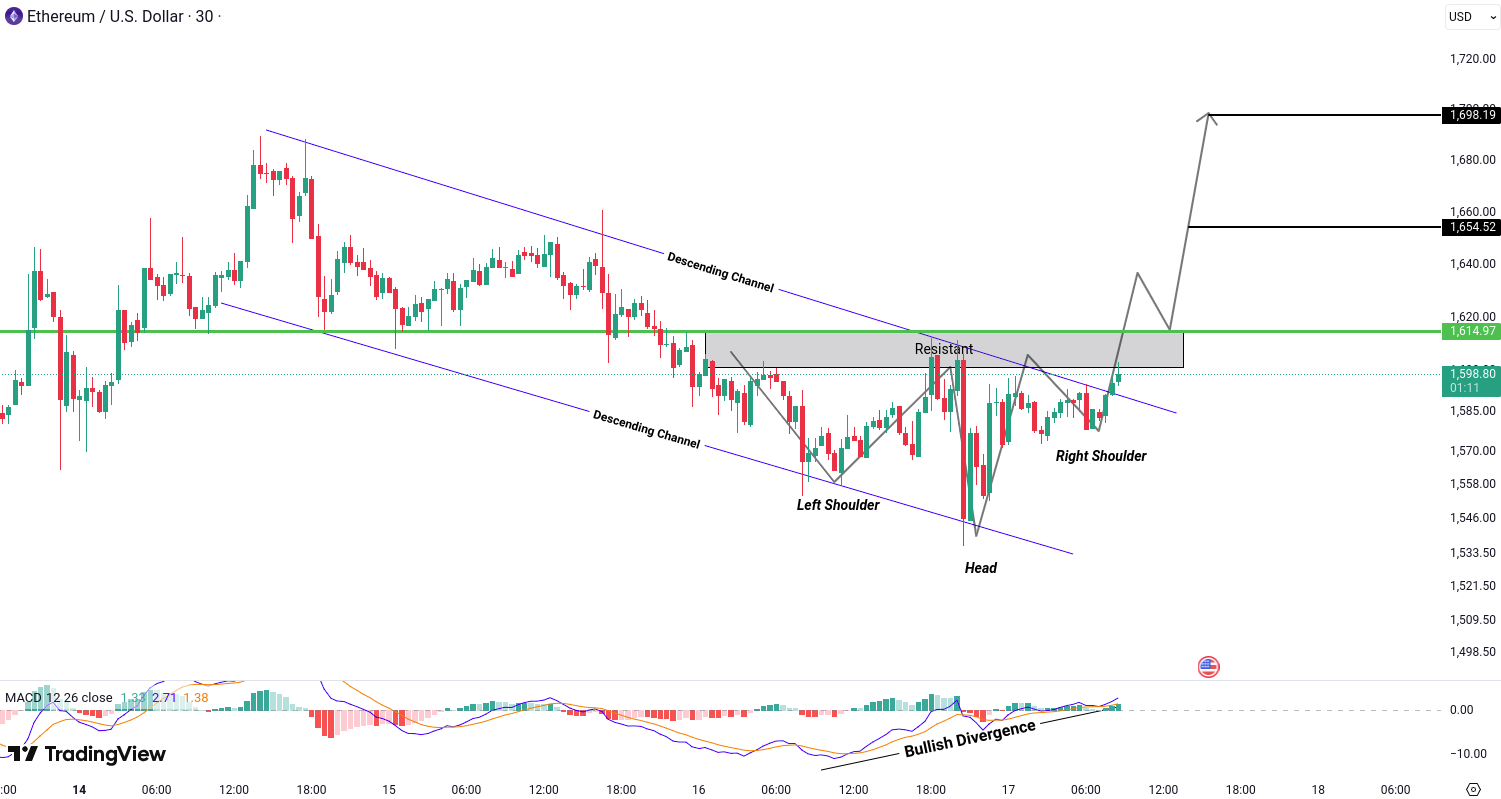
Ethereum (ETH) shows bullish potential after breaking out of a descending channel and forming an inverse head and shoulders pattern, supported by bullish divergence. These signals increase the probability of an upward move. For confirmation, we need a breakout and candle closing above the resistance zone at 1,614. If confirmed, the next potential upside targets are 1,654 and 1,698 USD.
MultiversX (EGLD) Analysis
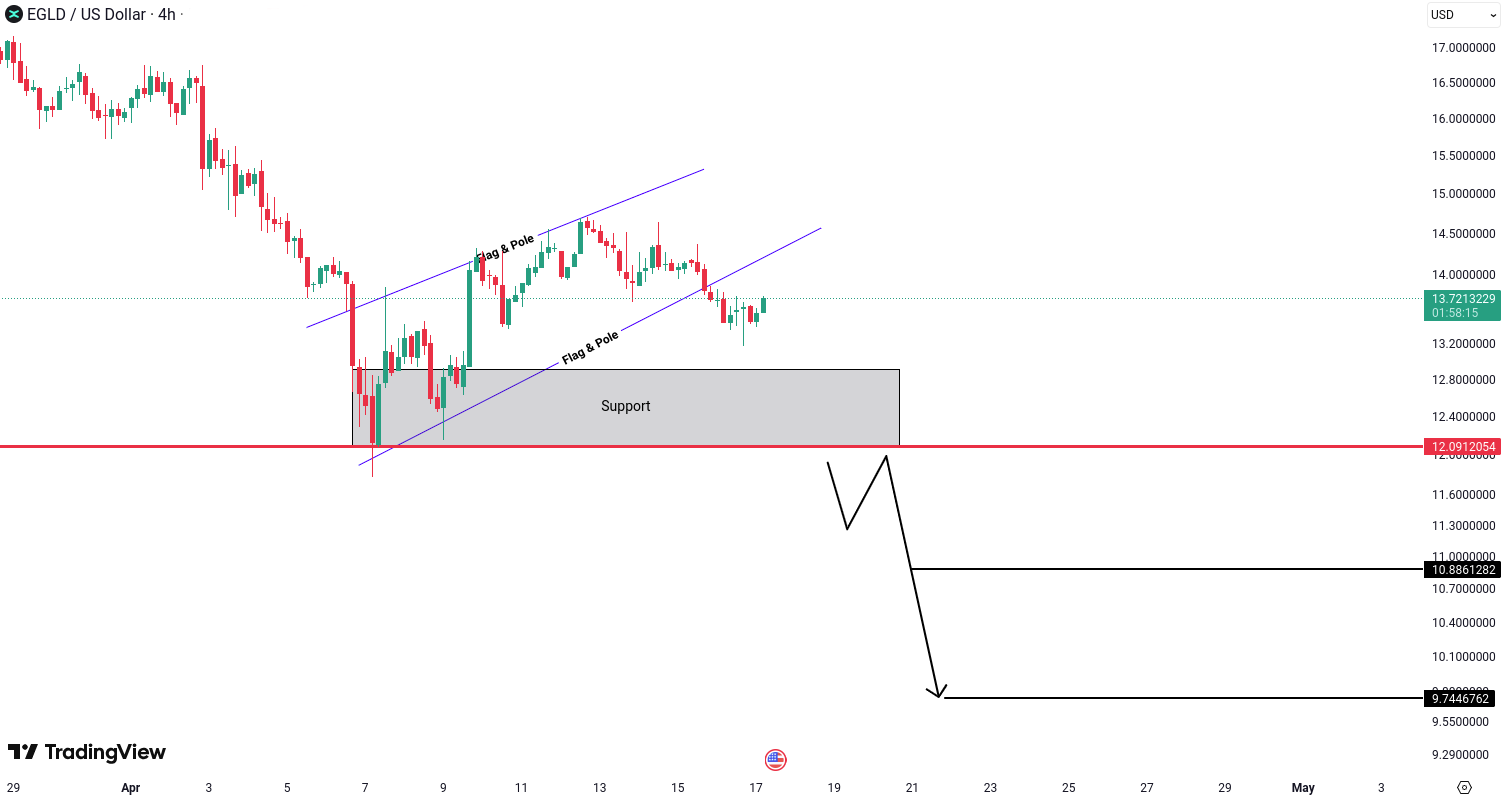
MultiversX (EGLD) remains in a bearish trend, making short opportunities more favorable. Additionally, it has formed a bear flag pattern, which further supports a bearish continuation. Confirmation requires a breakdown and candle closing below the support zone at 12.09. If this occurs, the next potential downside targets are 10.88 and 9.74 USD.
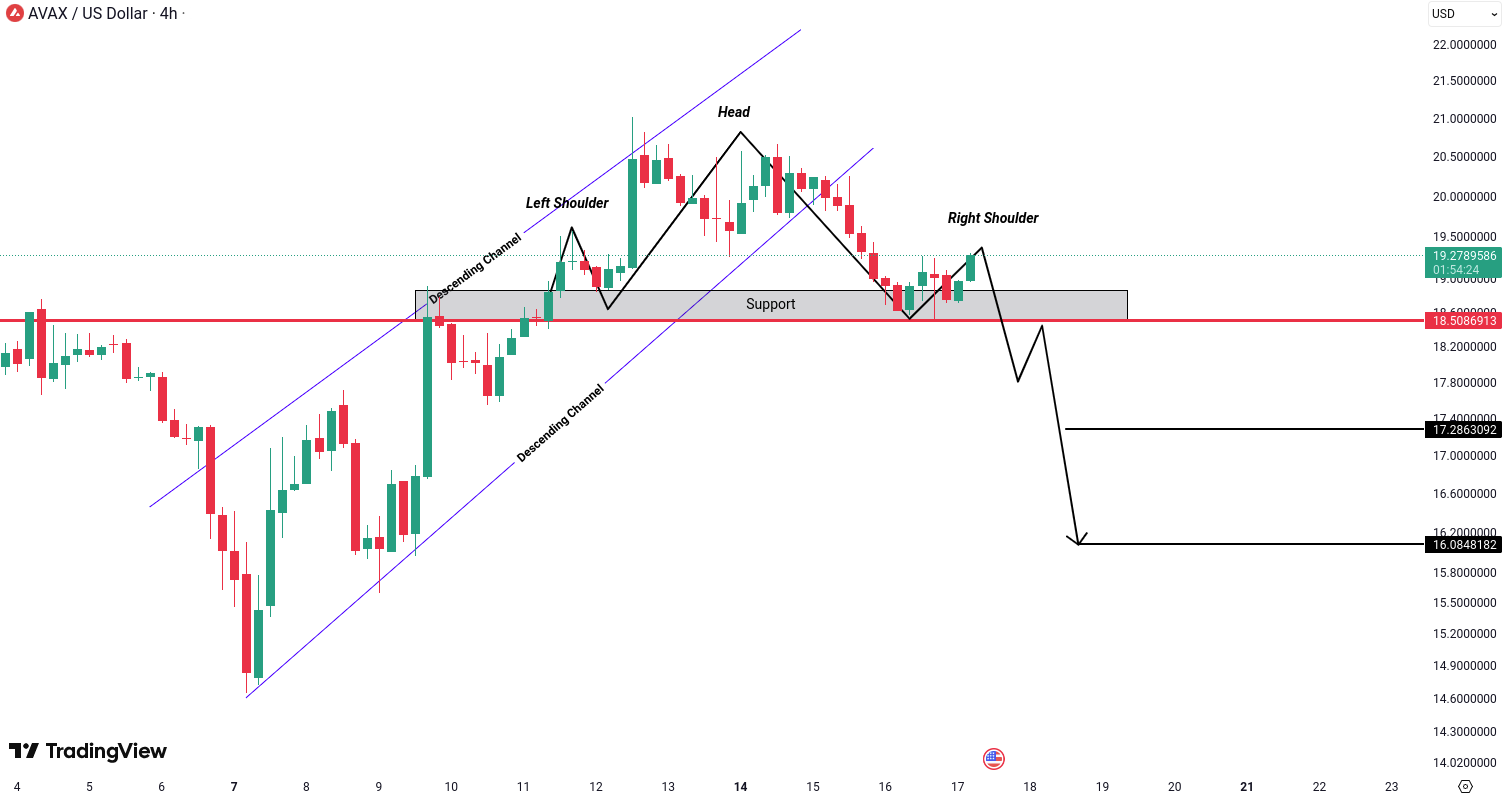
Avalanche (AVAX) Analysis
Avalanche (AVAX) is showing bearish signs after breaking down from a descending channel and forming a head and shoulders pattern. Both signals increase the probability of a downward move. However, we need a breakdown and candle closing below the support level at 18.50 to confirm. If this level is broken, the next downside targets could be 17.28 and 16.08 USD.
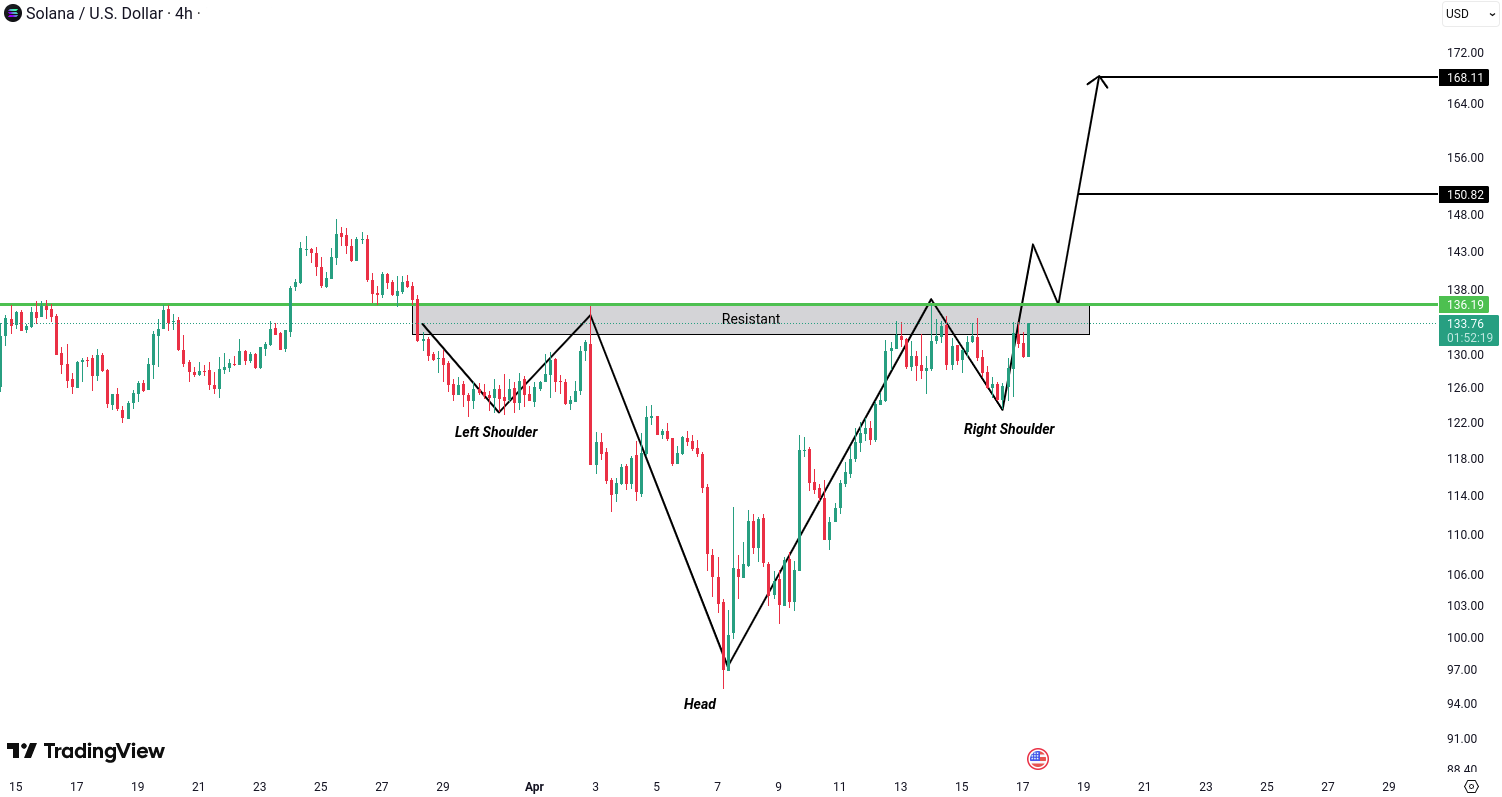
Solana (SOL) Analysis
Solana (SOL) is showing bullish potential due to the formation of an inverse head and shoulders pattern, which increases the probability of an upward move. For confirmation, we need a breakout and candle closing above the resistance zone at 136.19. If this breakout occurs, it could open the way for upside targets at 150.82 and 168.11 USD.
All cryptocurrencies are available for trading on Tradesilvania , and their prices can be seen on the Tradesilvania price page, accessible through the following link: https://tradesilvania.com/en/prices
With the help of our platform, you can deposit, withdraw, buy or sell any of these cryptocurrencies using the free digital wallet. SEPA Top-up (On-Ramp & Off-Ramp) Euro and RON instant transfers and over 100 cryptocurrencies, are all available in our app.

Limitation of Liability
This report issued by Tradesilvania is purely informative and is not intended to be used as a tool for making investment decisions in crypto-assets. Any person who chooses to use this report in the process of making investment decisions assumes all related risks. Tradesilvania SRL has no legal or other obligation towards the person in question that would derive from the publication of this report publicly.
The content provided on the Tradesilvania website is for informational purposes only and should not be considered as investment advice, financial advice, trading advice, or any other form of advice. We do not endorse or recommend the buying, selling, or holding of any cryptocurrency. It is important that you conduct your own research and consult with a financial advisor before making any investment decisions. We cannot be held responsible for any investment choices made based on the information presented on our website.
The information in this report was obtained from public sources and is considered relevant and reliable within the limits of publicly available data. However, the value of the digital assets referred to in this report fluctuates over time, and past performance does not indicate future growth.