Crypto analysis for BTC, ETH, EGLD, LTC and FLOKI - September 25, 2025

Crypto market in the last 24 hours:
🌐 Global Market Cap: $3.82T (-1.89%)
📊 Total 24h Volume: $176.51B (+9.04%)
💰 DeFi Volume: $24.05B (13.63% of total volume)
🔒 Stablecoin Volume: $174.35B (98.78% of total volume)
💵 Bitcoin Dominance: 58.2% (+0.46%)
Bitcoin (BTC) Analysis
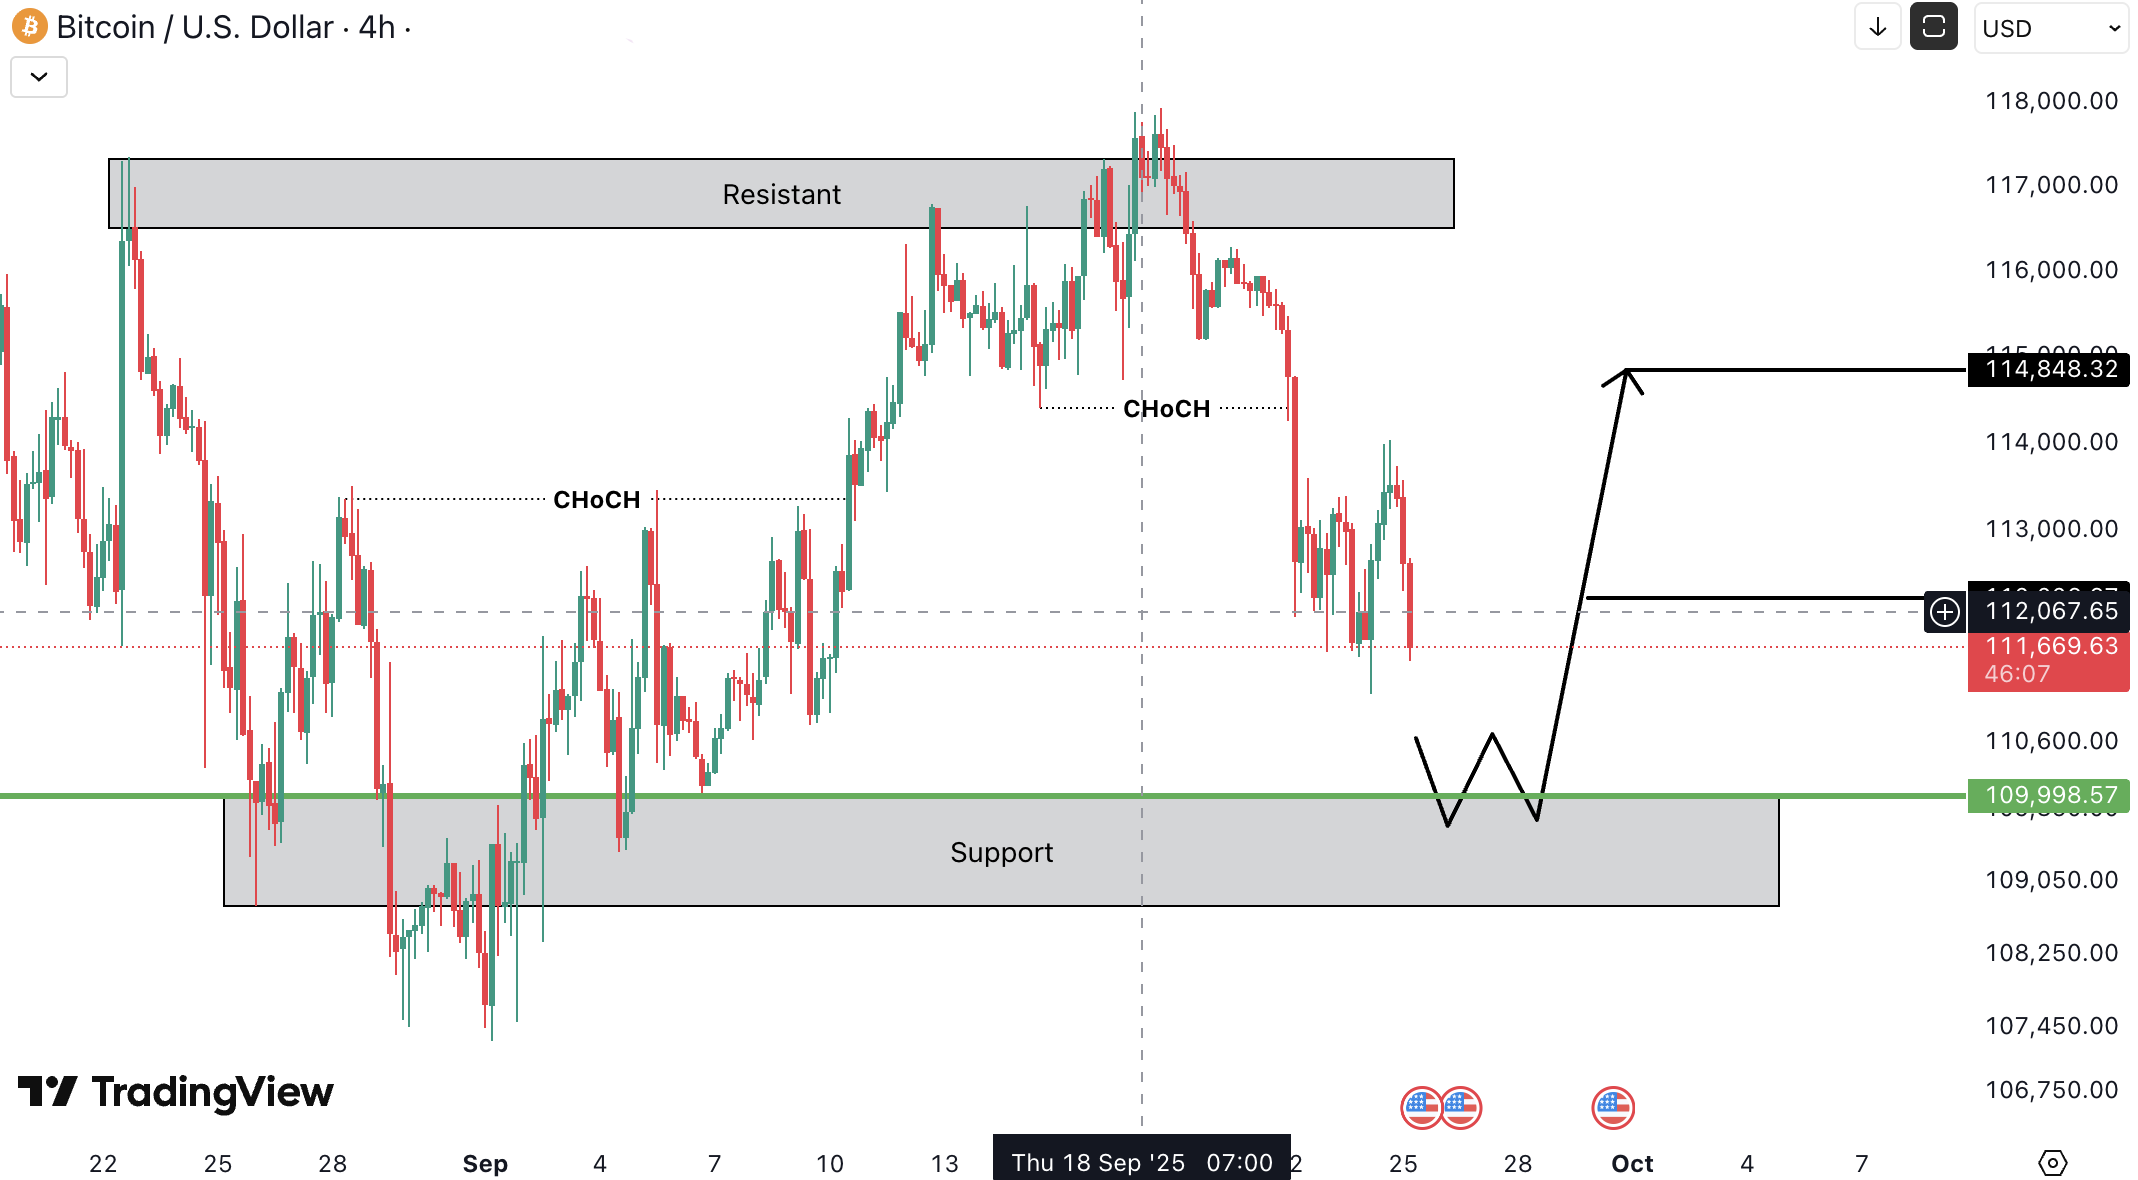
BTC has shown a double CHoCH, suggesting the beginning of a sideways or volatile range. Based on this, we can expect a potential bounce from the support zone at 109,998 USD.
If bullish confirmation appears here — such as a W pattern or an inverse head & shoulders — the probability of a bullish move increases significantly. In that case, upside targets are 112,226 USD and 114,848 USD.
Ethereum (ETH) Analysis
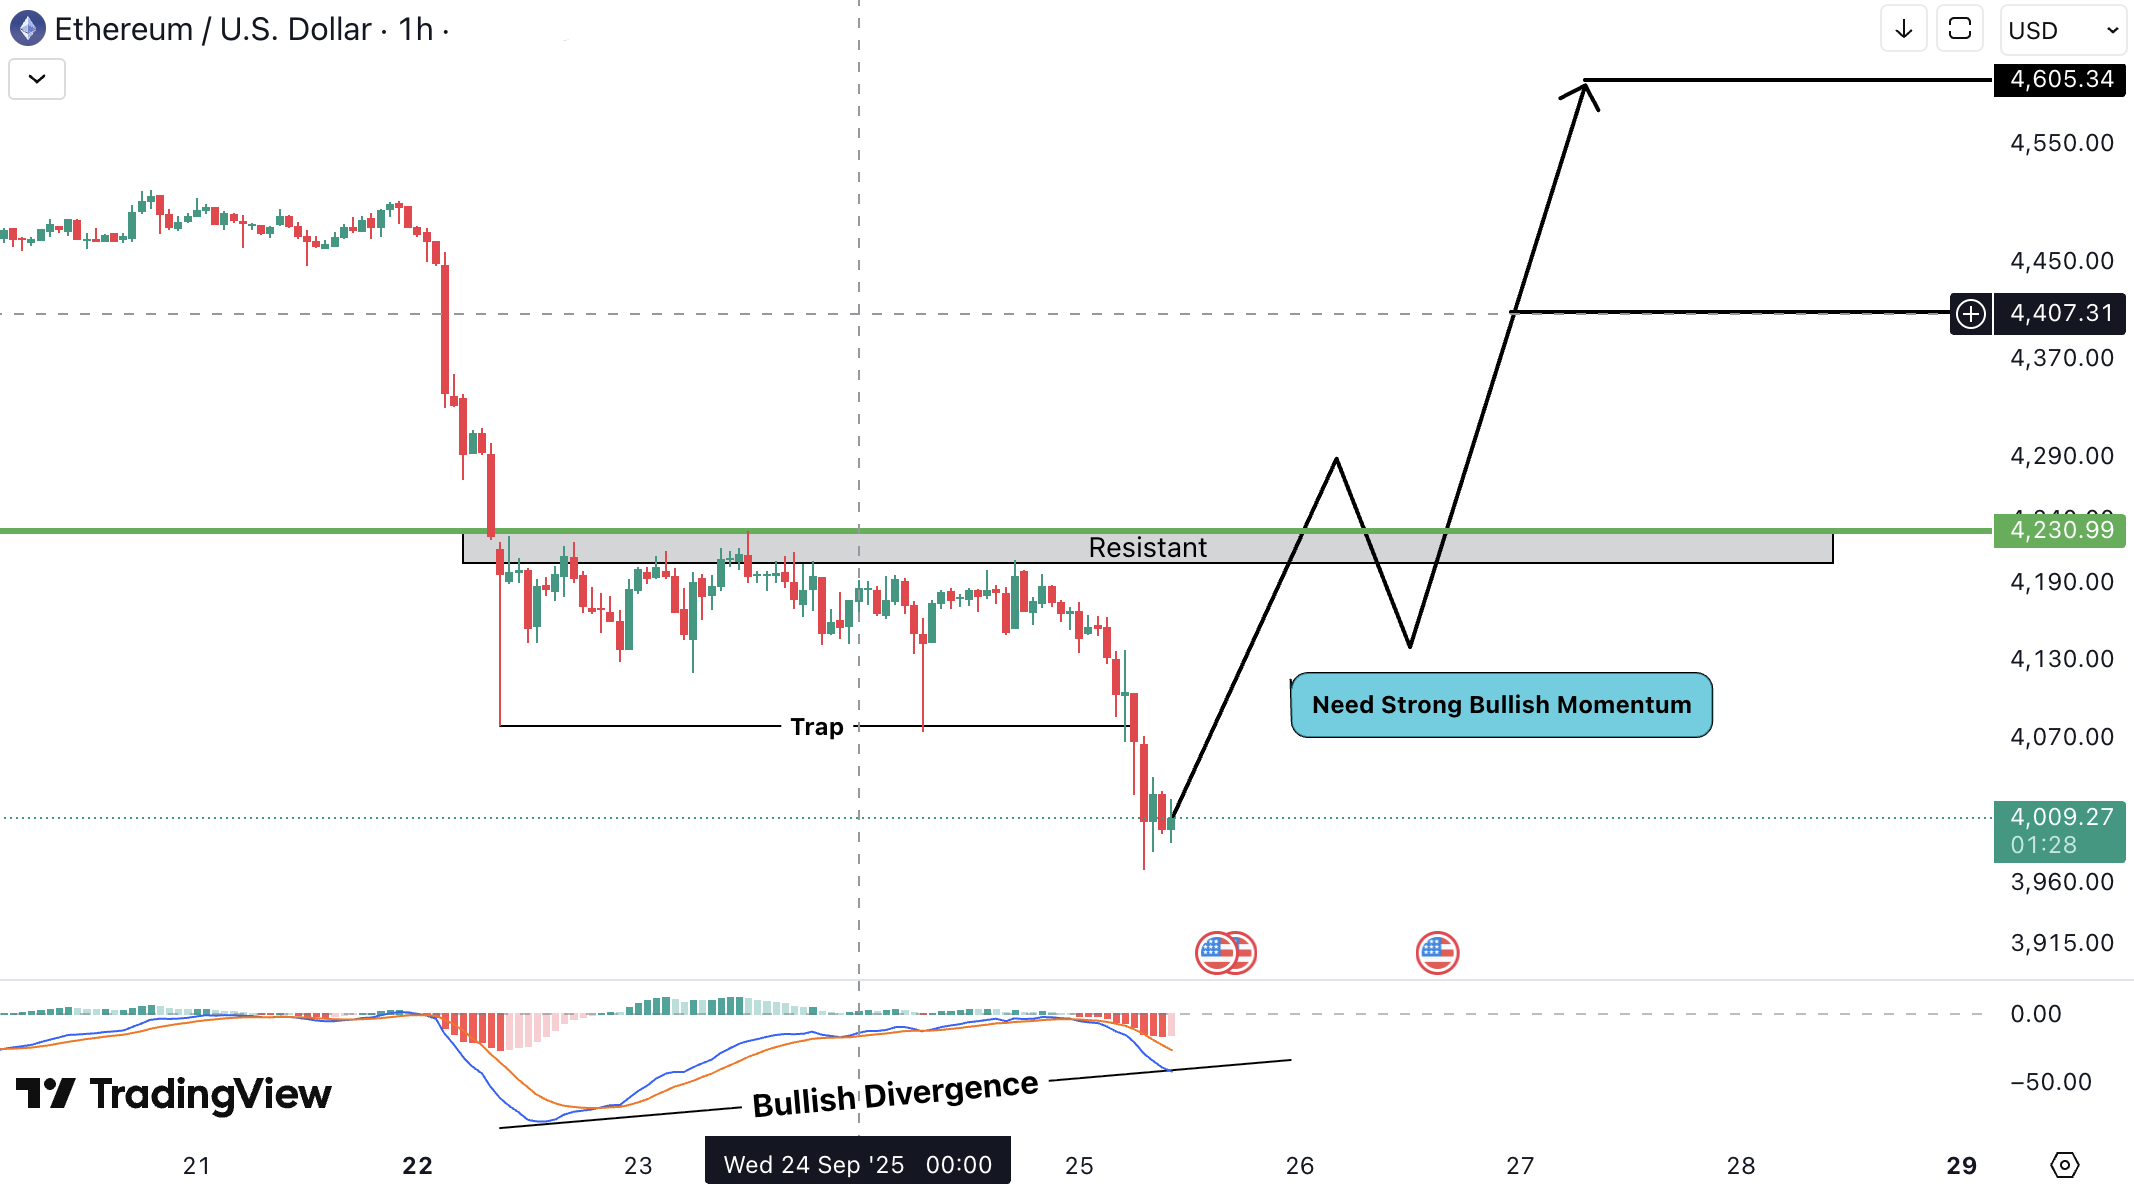
ETH is showing bullish divergence, indicating the potential to trap late sellers in the short term. However, such traps typically require a fast move.
For confirmation, we need a bullish CHoCH along with a breakout and candle close above the resistance zone at 4,230 USD, ideally with strong momentum.
If this condition is met, upside targets are 4,409 USD and 4,605 USD.
MultiversX (EGLD) Analysis
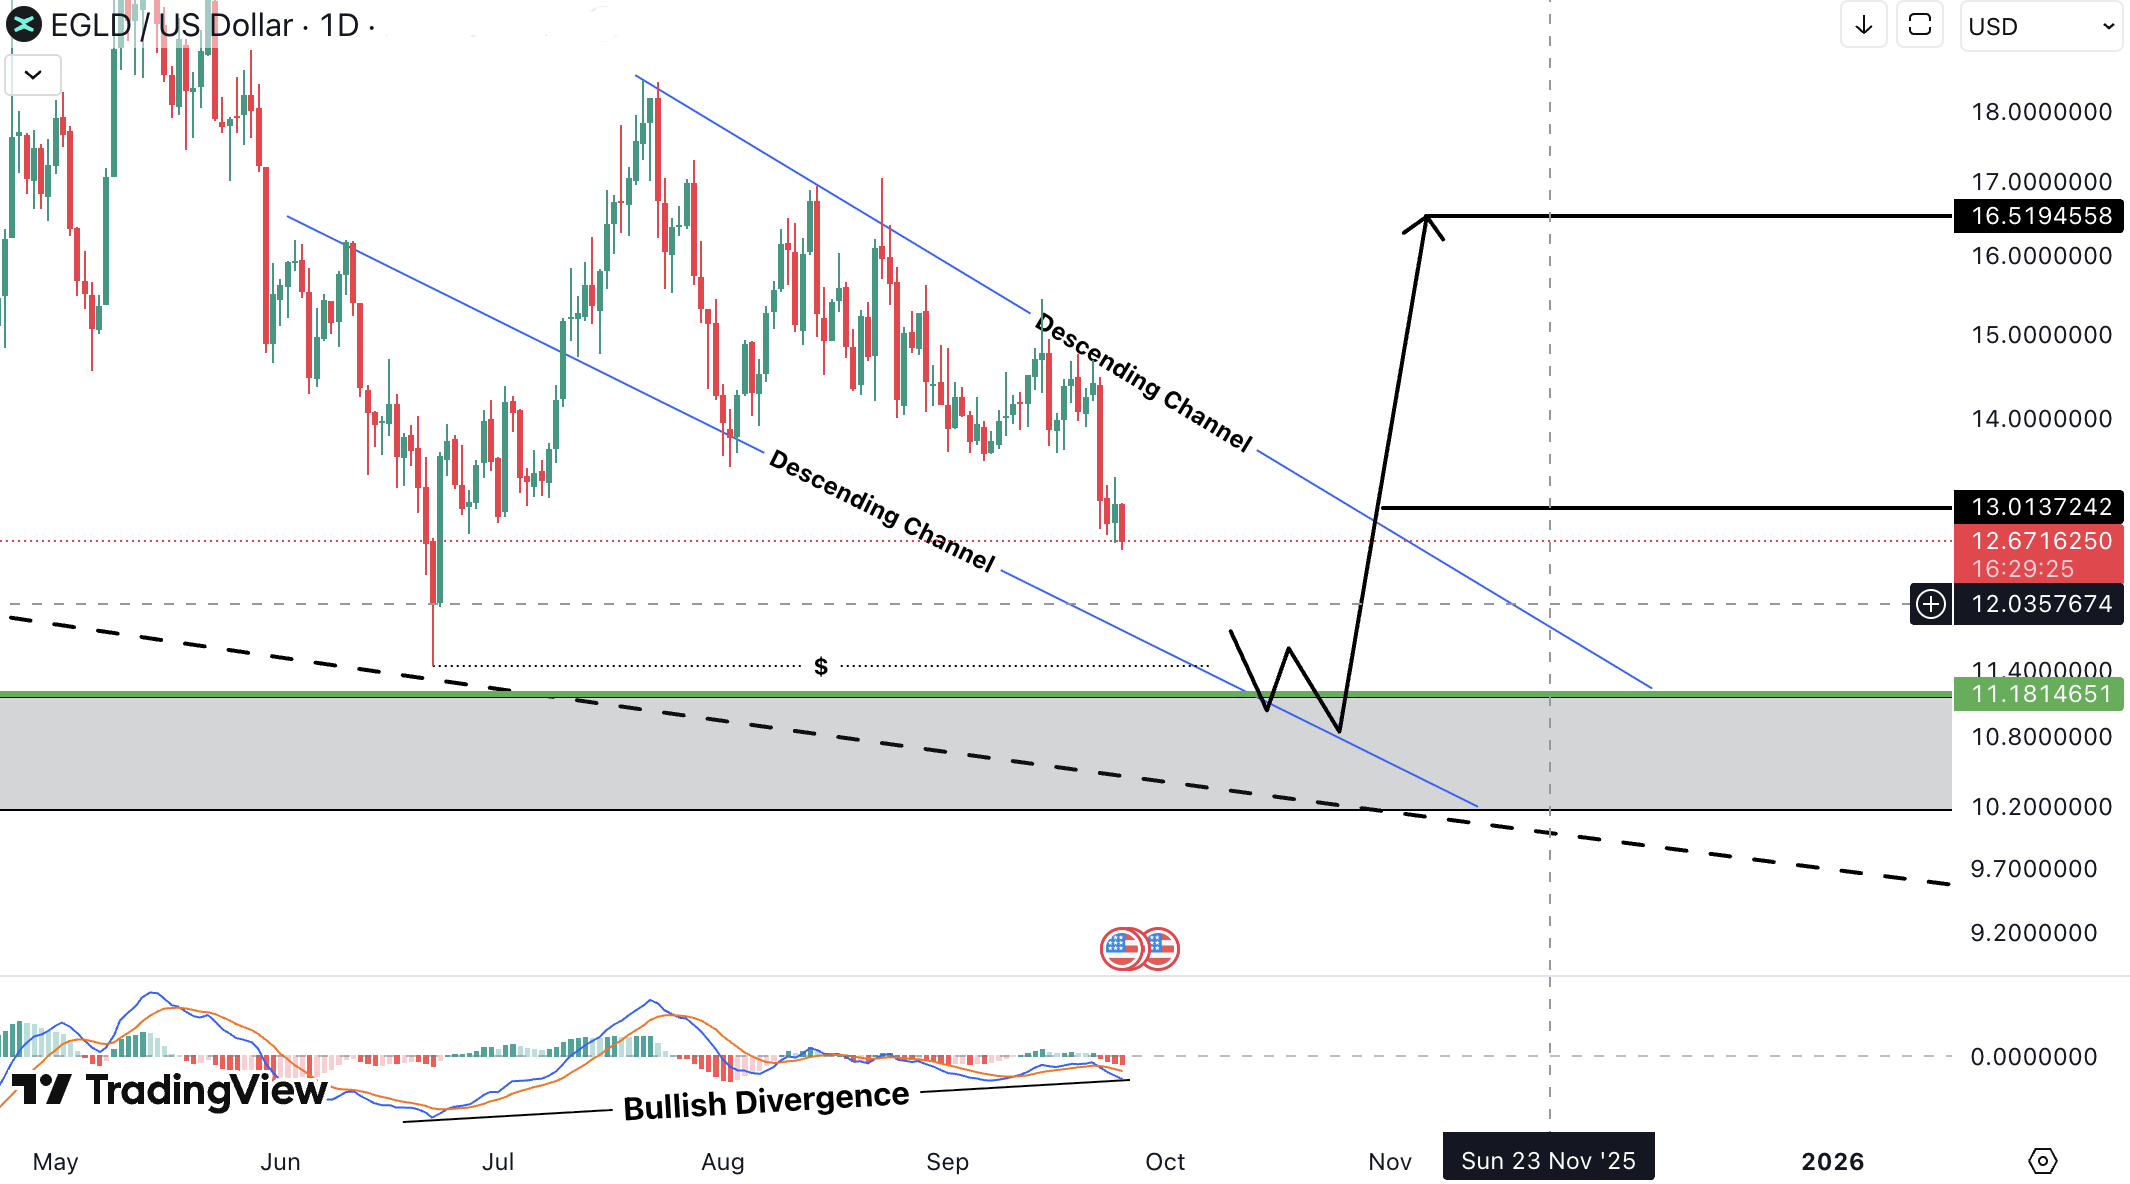
EGLD is currently looking bearish, as it continues to follow a descending channel. However, a potential bounce could occur from the support zone at 11.18 USD, which is also supported by the channel’s trendline.
For confirmation, we need bullish signals here — such as a W pattern, an inverse head & shoulders, or bullish divergence. If these conditions are met, upside targets are 13.01 USD and 16.51 USD.
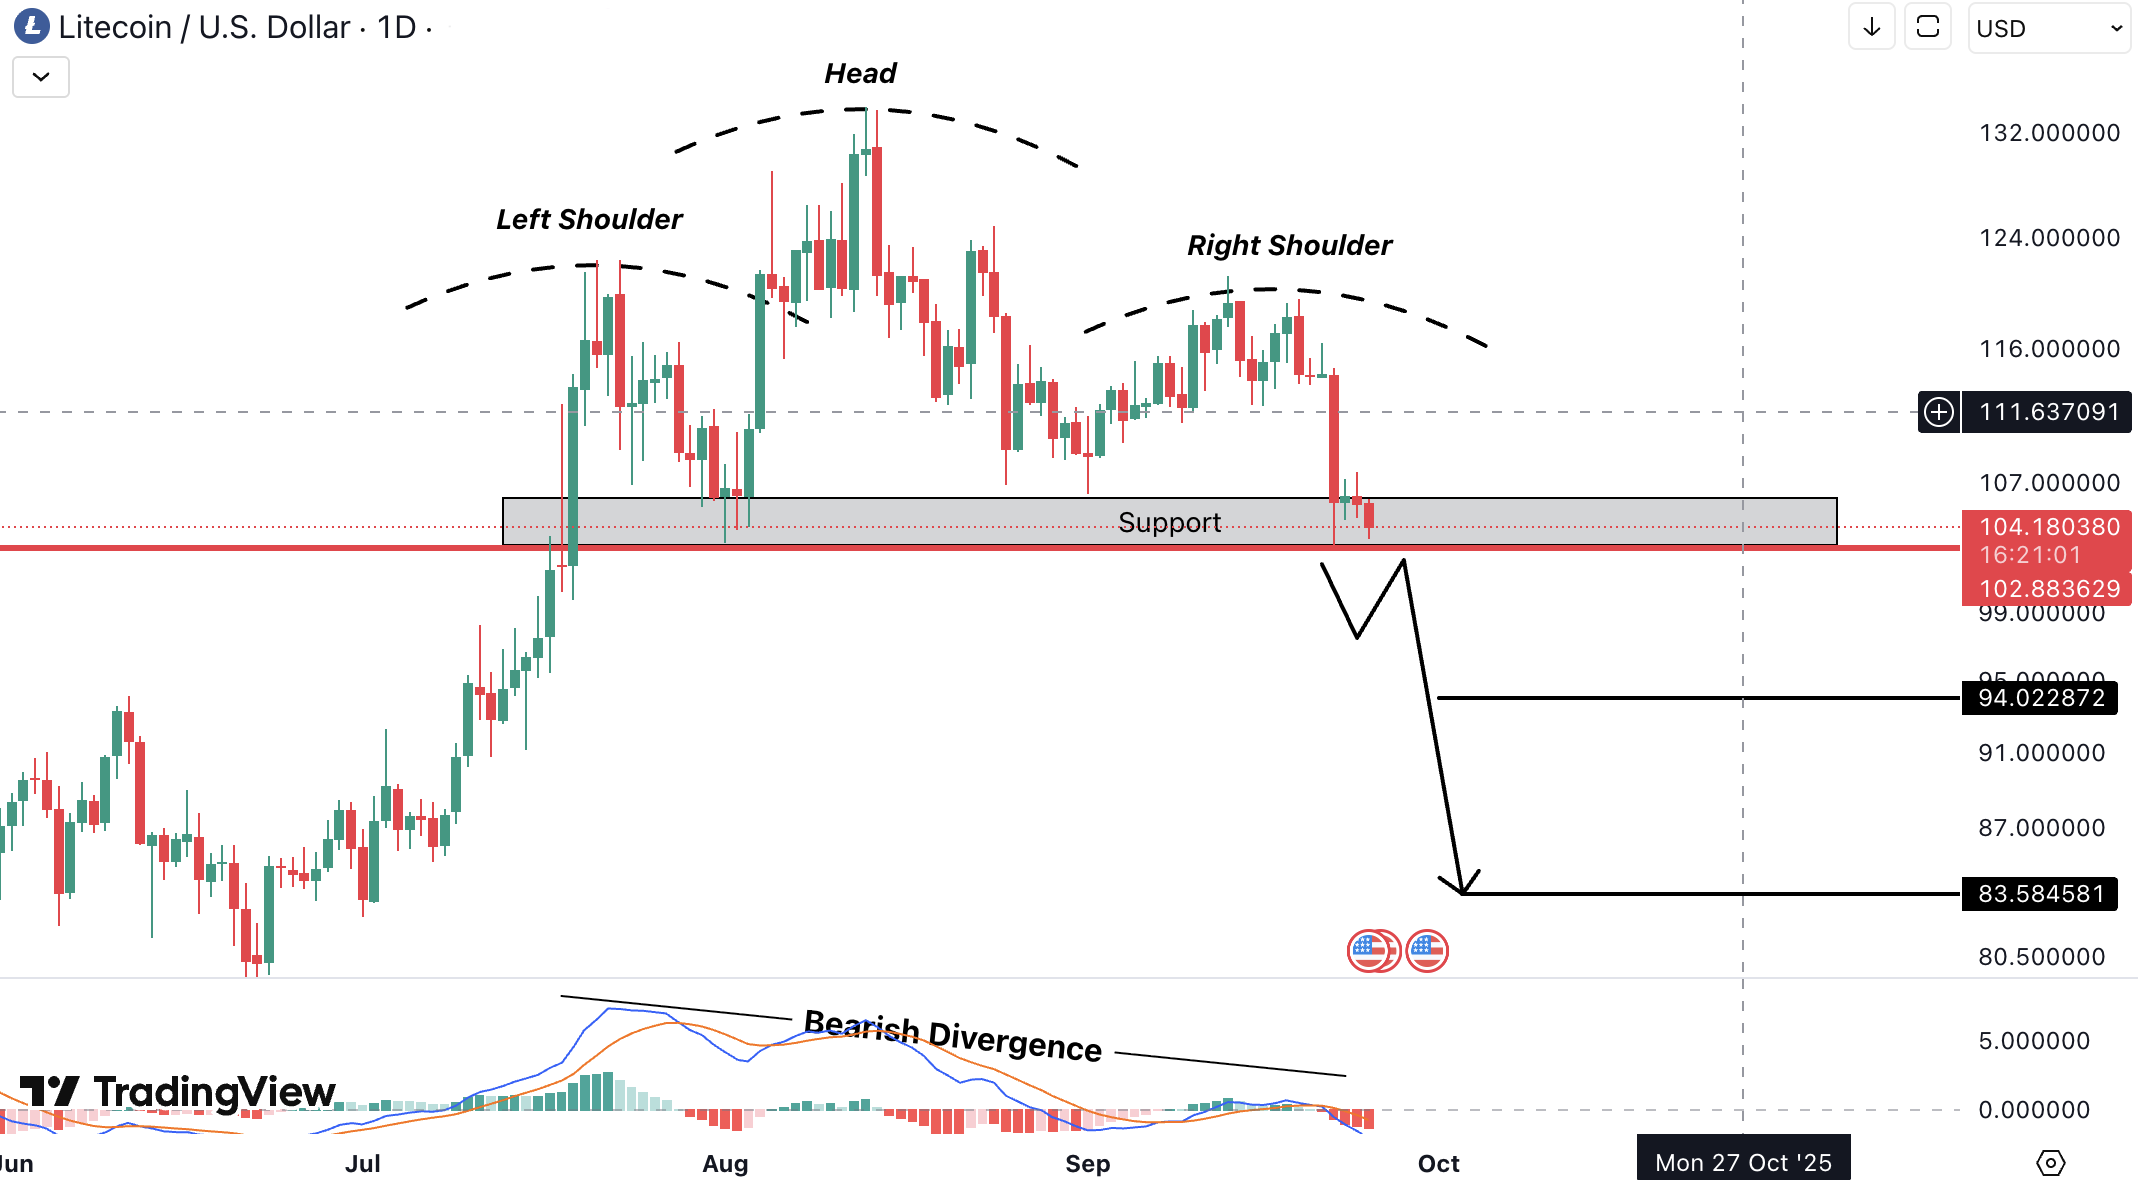
Litecoin (LTC) Analysis
LTC looks bearish as it has formed a head & shoulders pattern along with bearish divergence, increasing the probability of a downside move.
For confirmation, we need a breakdown and candle close below the support zone at 104.44 USD. If this occurs, downside targets are 94.02 USD and 83.58 USD.
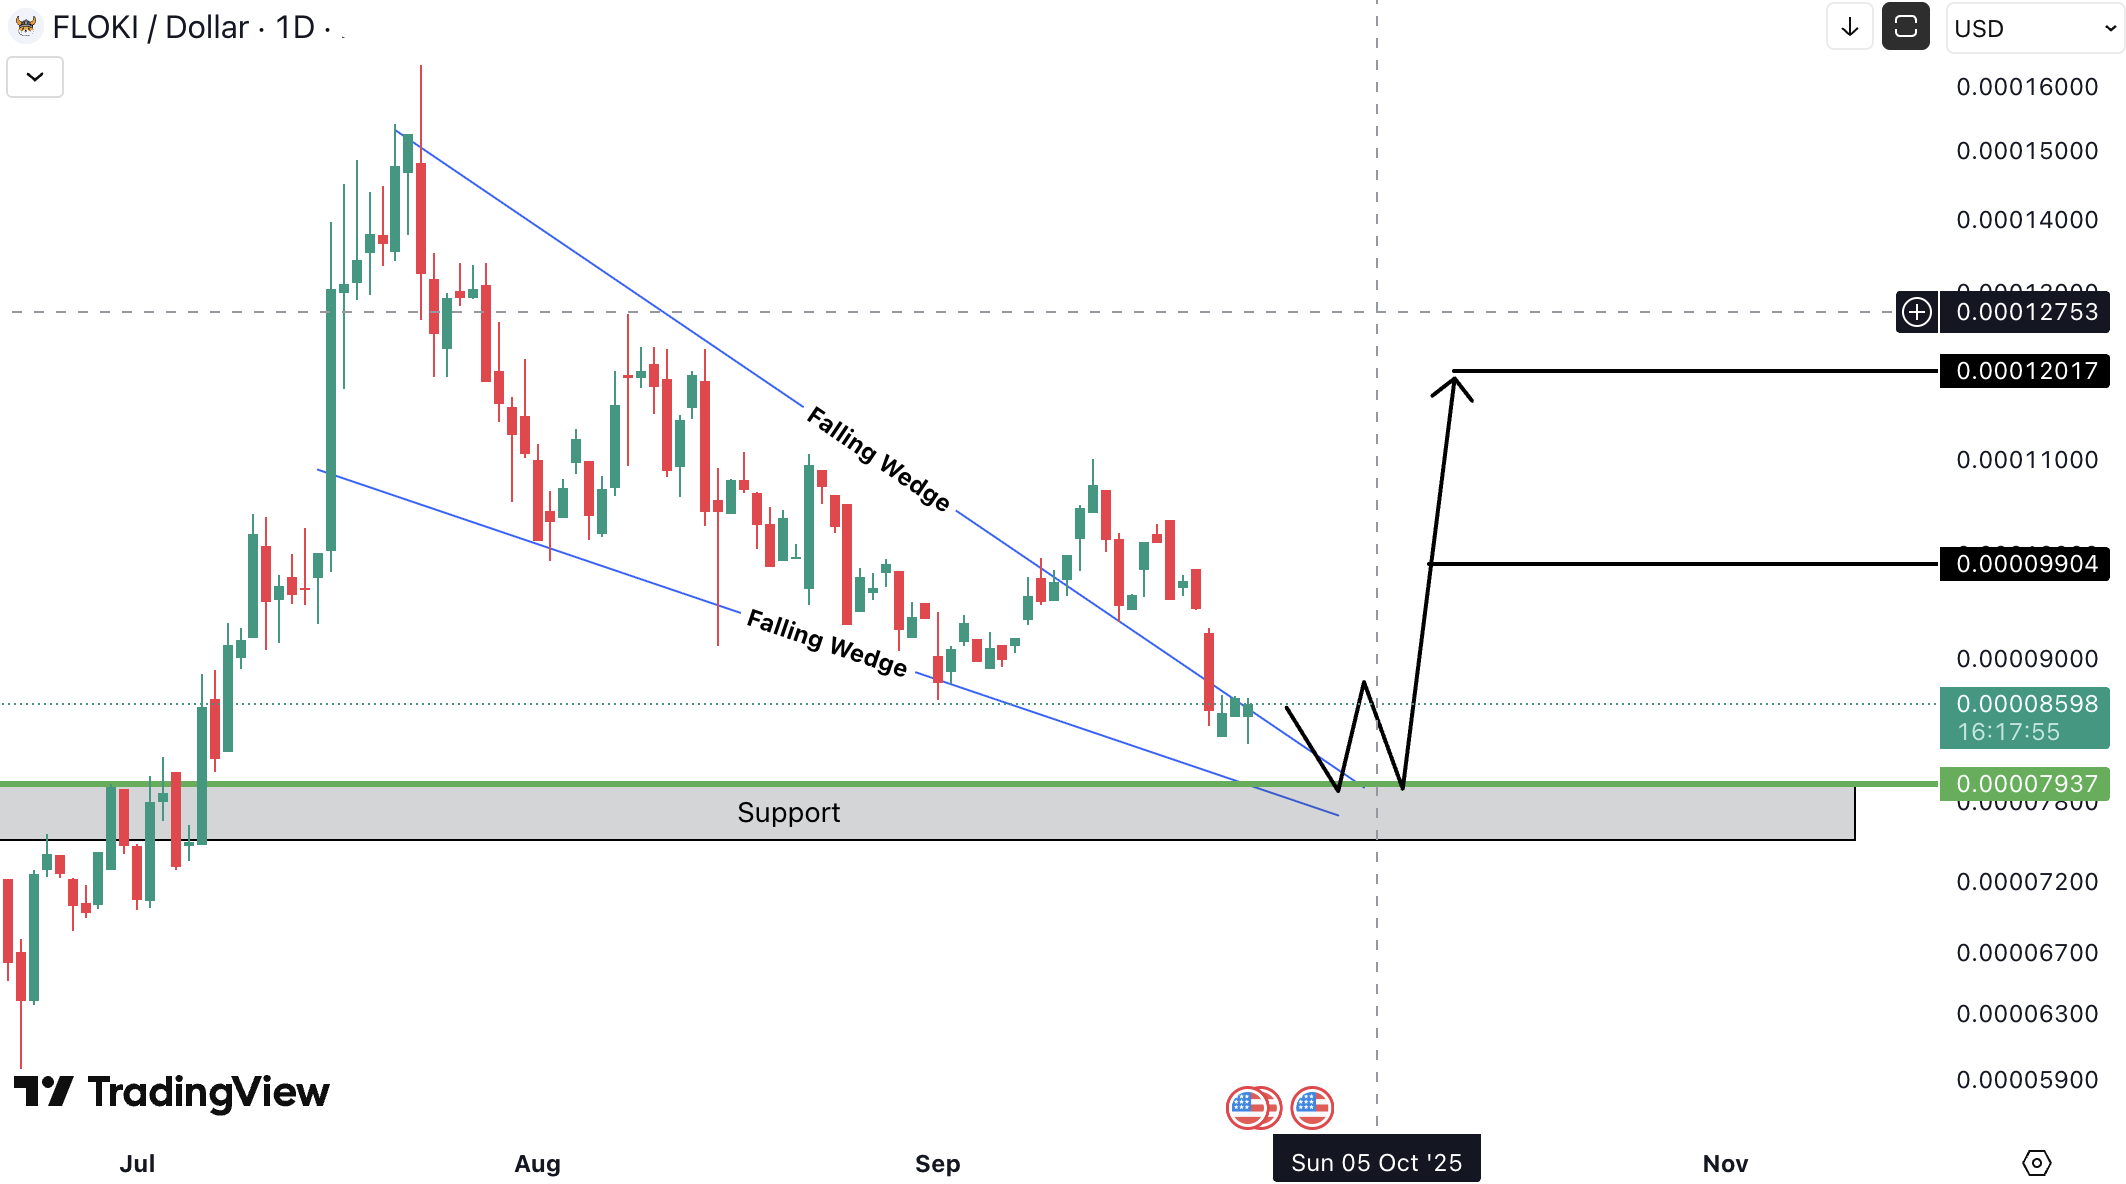
Floki (FLOKI) Analysis
FLOKI has broken out of a falling wedge pattern and is now approaching the support zone at 7,937 USD.
For confirmation of a bullish move, we need to see bullish signals here — such as a W pattern, an inverse head & shoulders, or bullish divergence. If these conditions are met, upside targets are 9,904 USD and 12,017 USD.
📈 Our Short-Term Estimates (96H)
Disclaimer: These are our personal opinions, not financial advice. We invest our own money — and sometimes we lose. DYOR!
- BTC - 1% to 2% - UP - Going to approach support zone
- ETH - 1% to 3%- UP - can follow BTC (Low Probability)
- GALA - 2% to 4%- UP - At support
- FIL - 2% to 4%- UP - At support
- FLOKI - 2% to 4%- UP - Going to approach support zone
All cryptocurrencies are available for trading on Tradesilvania , and their prices can be seen on the Tradesilvania price page, accessible through the following link: https://tradesilvania.com/en/prices
With the help of our platform, you can deposit, withdraw, buy or sell any of these cryptocurrencies using the free digital wallet. SEPA Top-up (On-Ramp & Off-Ramp) Euro and RON instant transfers and over 100 cryptocurrencies, are all available in our app.
Limitation of Liability
This report issued by Tradesilvania is purely informative and is not intended to be used as a tool for making investment decisions in crypto-assets. Any person who chooses to use this report in the process of making investment decisions assumes all related risks. Tradesilvania SRL has no legal or other obligation towards the person in question that would derive from the publication of this report publicly.
The content provided on the Tradesilvania website is for informational purposes only and should not be considered as investment advice, financial advice, trading advice, or any other form of advice. We do not endorse or recommend the buying, selling, or holding of any cryptocurrency. It is important that you conduct your own research and consult with a financial advisor before making any investment decisions. We cannot be held responsible for any investment choices made based on the information presented on our website.
The information in this report was obtained from public sources and is considered relevant and reliable within the limits of publicly available data. However, the value of the digital assets referred to in this report fluctuates over time, and past performance does not indicate future growth.