Crypto analysis for BTC, ETH, EGLD, XRP and SUI - July 3, 2025

Crypto market in the last 24 hours:
🌐 Global Market Cap: $3.39T (+2.79%)
📊 24h Volume: $134.88B (+1.27%)
💰 DeFi Volume: $36.54B (27.09% of total volume)
🔒 Stablecoins Volume: $130.20B (96.53% of total volume)
💵 Bitcoin Dominance: 64.3% (+1.15%)
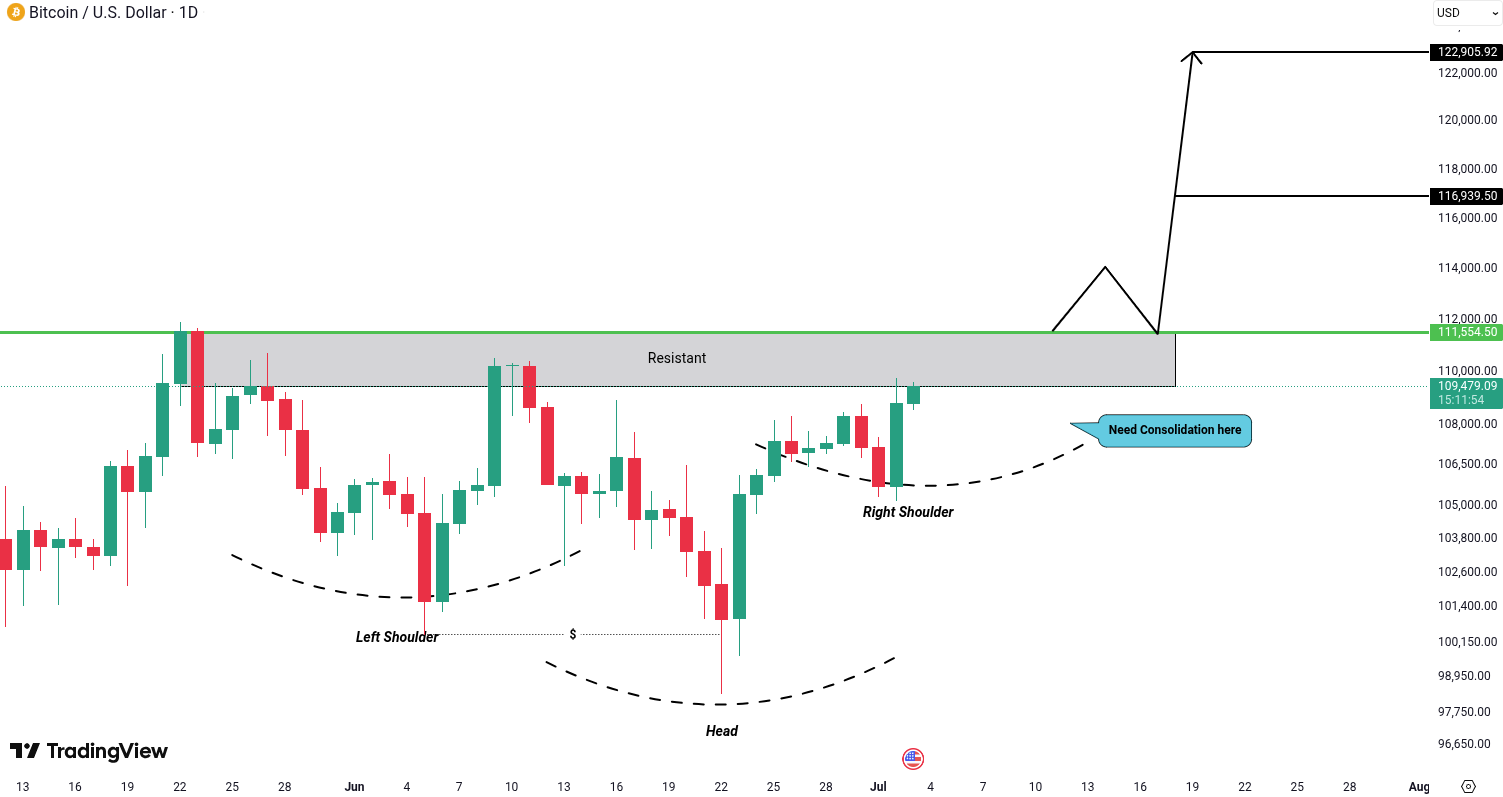
Bitcoin (BTC) Analysis
BTC is currently forming an inverse Head and Shoulders pattern, which can also be seen as a potential bull flag — both are bullish continuation setups. Ideally, some more consolidation at current levels would allow the inverse Head and Shoulders to develop more clearly. For confirmation of a bullish move, we need a breakout and candle close above the resistance zone at 111,554 USD. If this happens, it could lead to a strong move up, with potential targets at 116,939 USD and 122,905 USD.
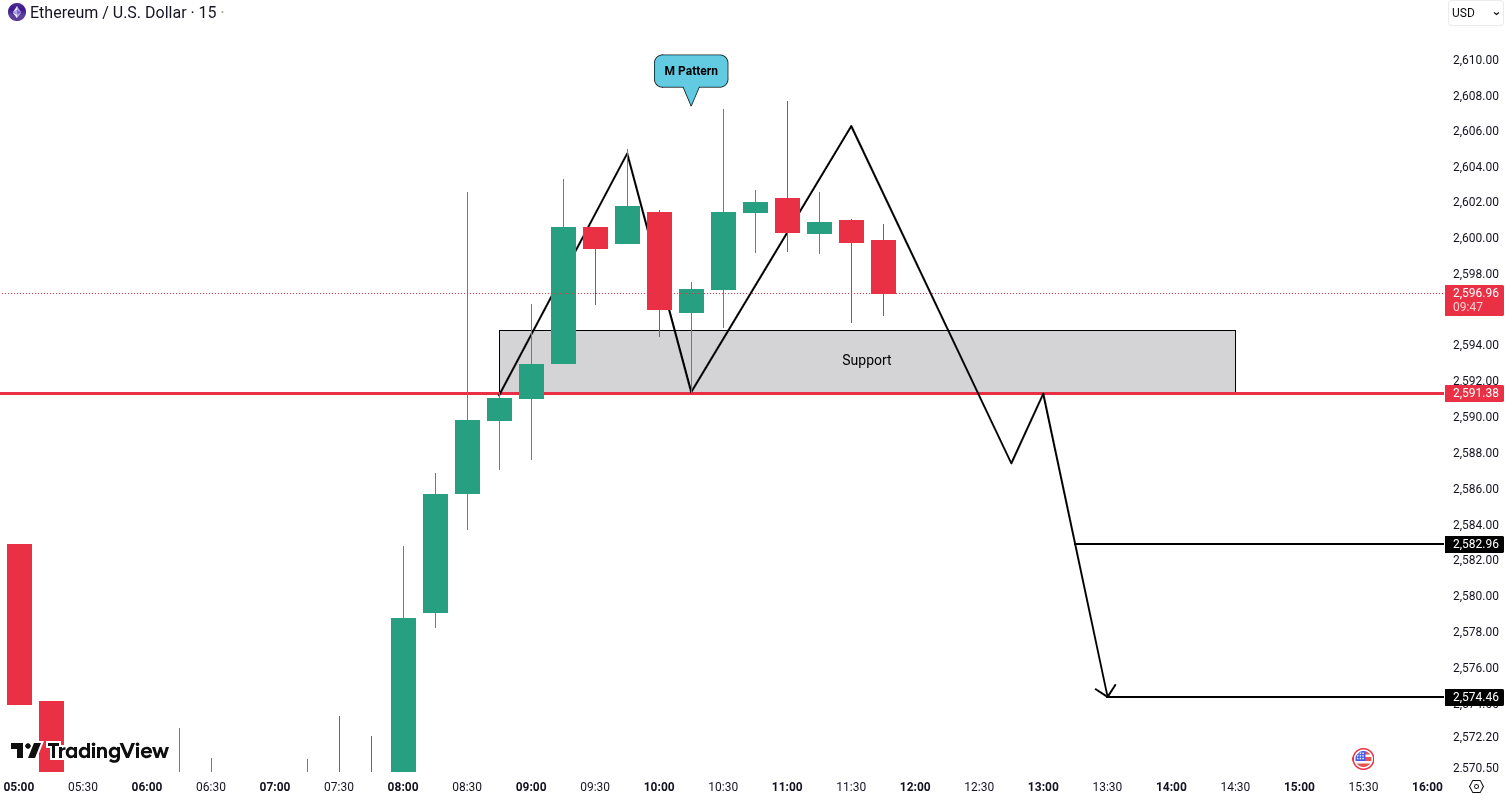
Ethereum (ETH) Analysis
ETH has formed an M pattern, which increases the chances of a bearish move. However, confirmation is needed through a breakdown and candle close below the support zone at 2,591 USD. If this level breaks, we could see further downside with targets at 2,582 USD and 2,574 USD.
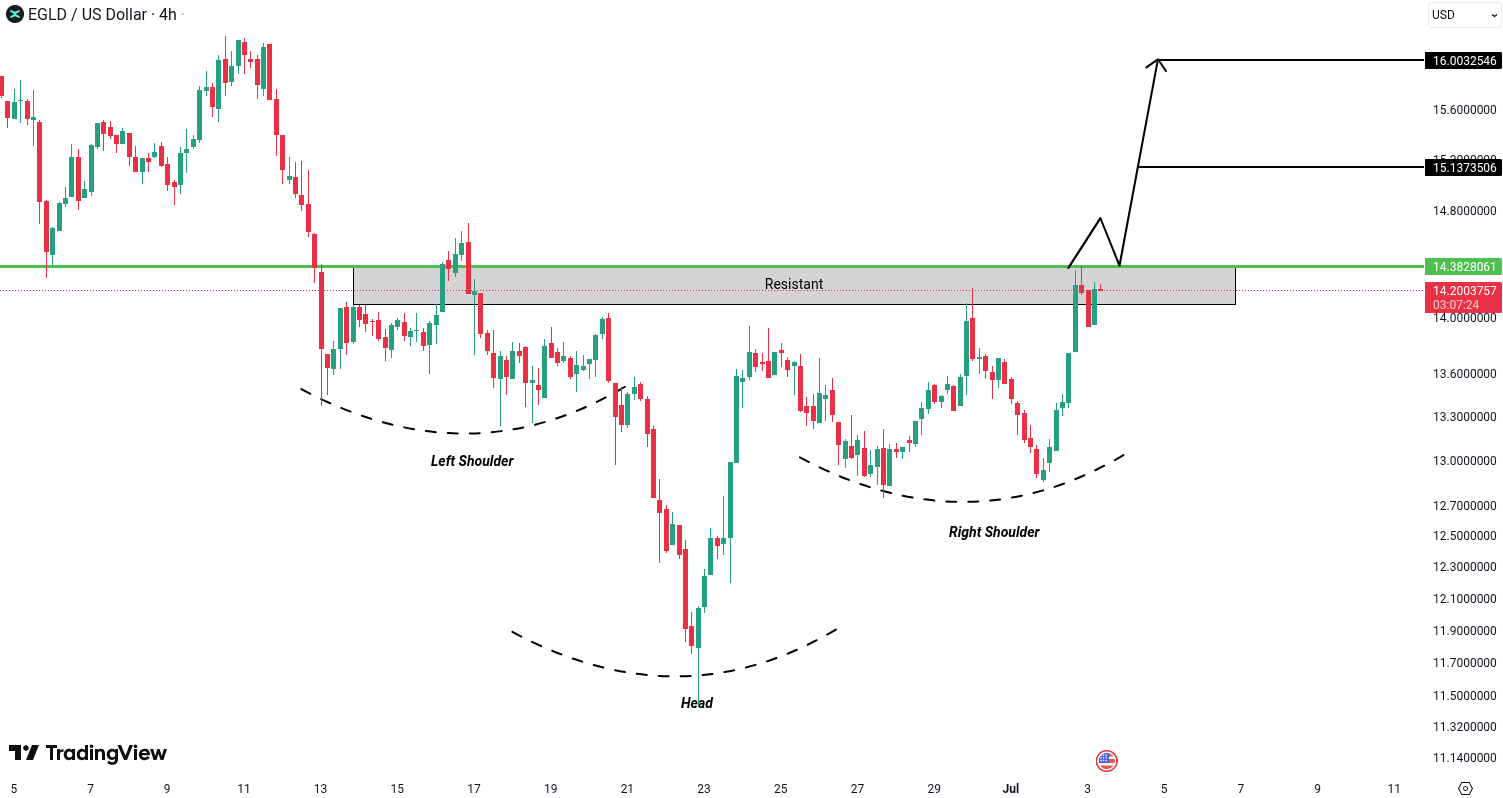
MultiversX (EGLD) Analysis
EGLD is showing signs of a potential bullish reversal due to the formation of an inverse Head and Shoulders pattern, which increases the probability of an upward move. However, confirmation is needed through a breakout and candle close above the resistance zone at 14.38 USD. If this breakout happens, a bullish continuation is likely, with potential targets at 15.13 USD and 16.00 USD.
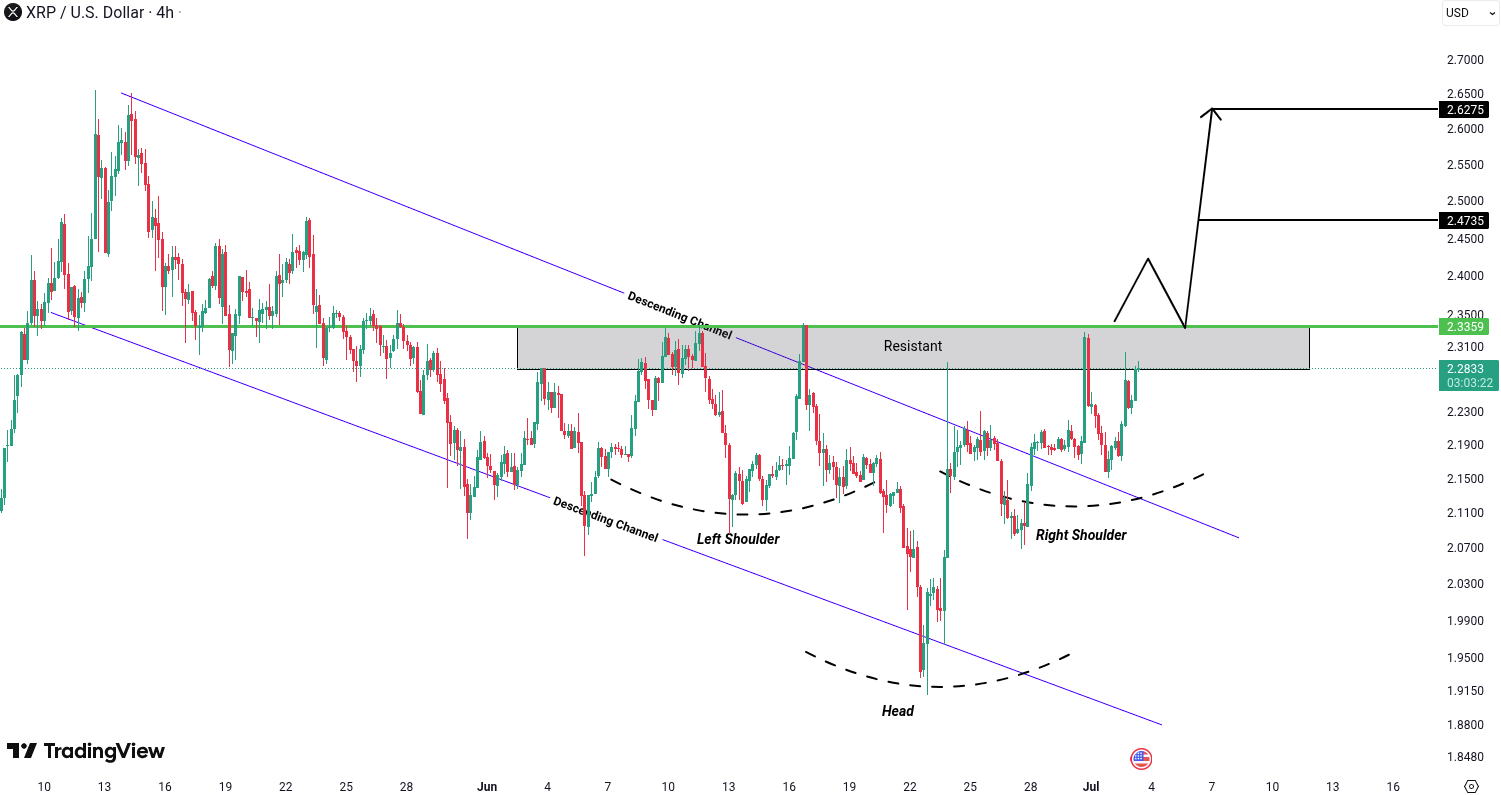
Ripple (XRP) Analysis
XRP has broken out of a descending channel and also formed an inverse Head and Shoulders pattern — both of which boost the probability of a bullish move. For confirmation, a breakout and candle close above the resistance zone at 2.33 USD is required. If this level is broken, we could see further upside toward 2.47 USD and 2.62 USD.
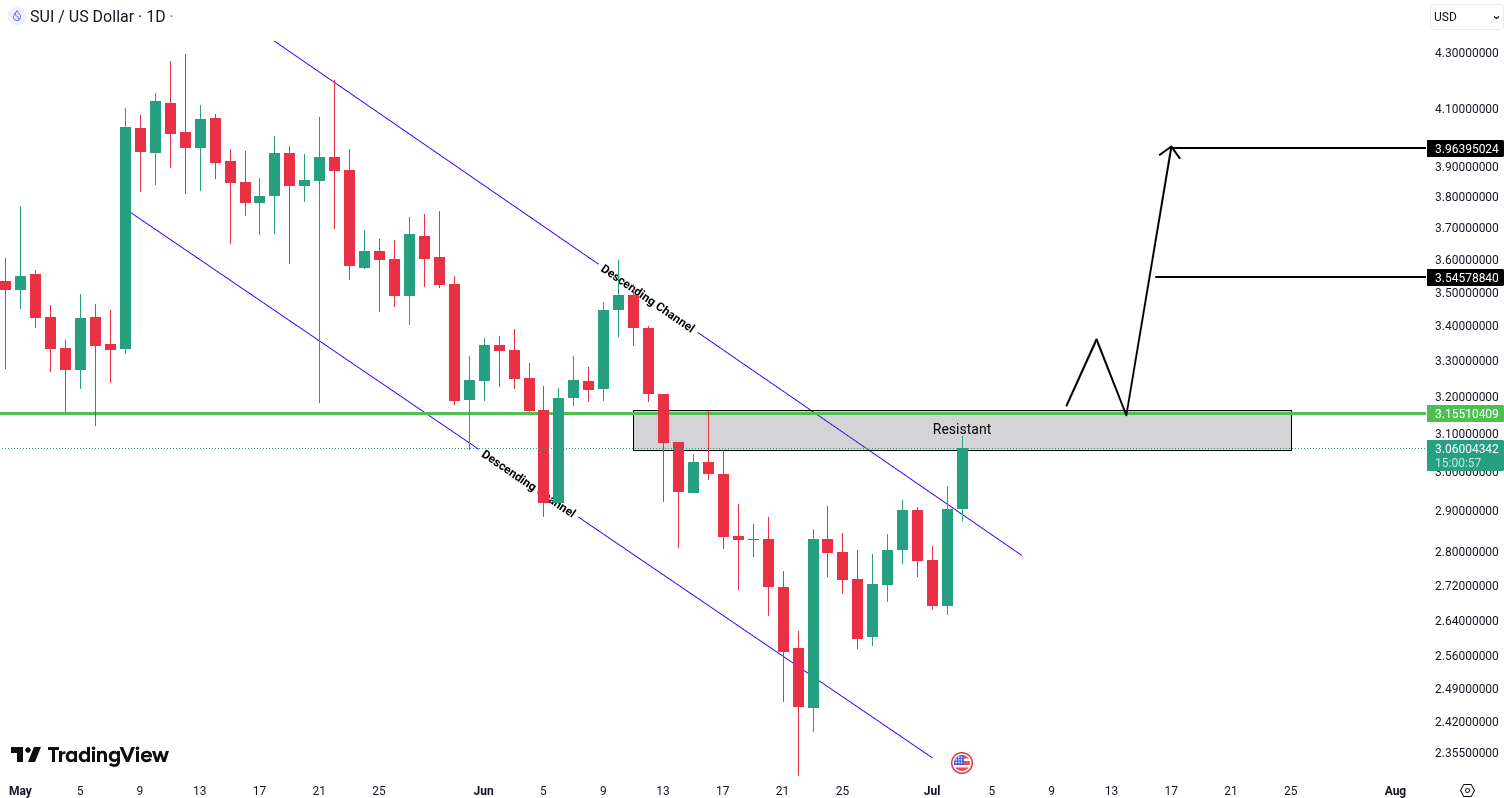
Sui (SUI) Analysis
SUI has broken out of a descending channel, increasing the likelihood of a bullish move. Still, full confirmation requires a breakout and candle close above the resistance at 3.15 USD. If that level is taken out, a bullish continuation could follow, with targets at 3.54 USD and 3.96 USD.
📈 Our Short-Term Estimates (96H)
Disclaimer: These are our personal opinions, not financial advice. We invest our own money — and sometimes we lose. DYOR!
- BTC - 1% to 3% - UP - Bull Flag
- ETH - 2% to 4%- UP - Bull Flag
- LTC - 2% to 4%- UP - Inverse head & shoulders
- PEPE - 2% to 6%- UP -W Patterns
- GALA - 2% to 4%- UP - W pattern
All cryptocurrencies are available for trading on Tradesilvania , and their prices can be seen on the Tradesilvania price page, accessible through the following link: https://tradesilvania.com/en/prices
With the help of our platform, you can deposit, withdraw, buy or sell any of these cryptocurrencies using the free digital wallet. SEPA Top-up (On-Ramp & Off-Ramp) Euro and RON instant transfers and over 100 cryptocurrencies, are all available in our app.
Limitation of Liability
This report issued by Tradesilvania is purely informative and is not intended to be used as a tool for making investment decisions in crypto-assets. Any person who chooses to use this report in the process of making investment decisions assumes all related risks. Tradesilvania SRL has no legal or other obligation towards the person in question that would derive from the publication of this report publicly.
The content provided on the Tradesilvania website is for informational purposes only and should not be considered as investment advice, financial advice, trading advice, or any other form of advice. We do not endorse or recommend the buying, selling, or holding of any cryptocurrency. It is important that you conduct your own research and consult with a financial advisor before making any investment decisions. We cannot be held responsible for any investment choices made based on the information presented on our website.
The information in this report was obtained from public sources and is considered relevant and reliable within the limits of publicly available data. However, the value of the digital assets referred to in this report fluctuates over time, and past performance does not indicate future growth.