Crypto Market Analysis and Bitcoin, Ethereum, Doge, MultiversX, and Mana - September 7, 2023

Crypto Market in the last 24 hours:
🌐Global crypto market: €975.29B, +0.76% (24h),
📊 24h Volume: €21.81B, -2.05%,
💼 DeFi: €1.9B, 8.70% of total,
💱 Stablecoin: €20.53B, 94.11% of total,
📈 Bitcoin dominance: 48.32%, +0.08%.
BITCOIN (BTC)
The Retail Seller Trap
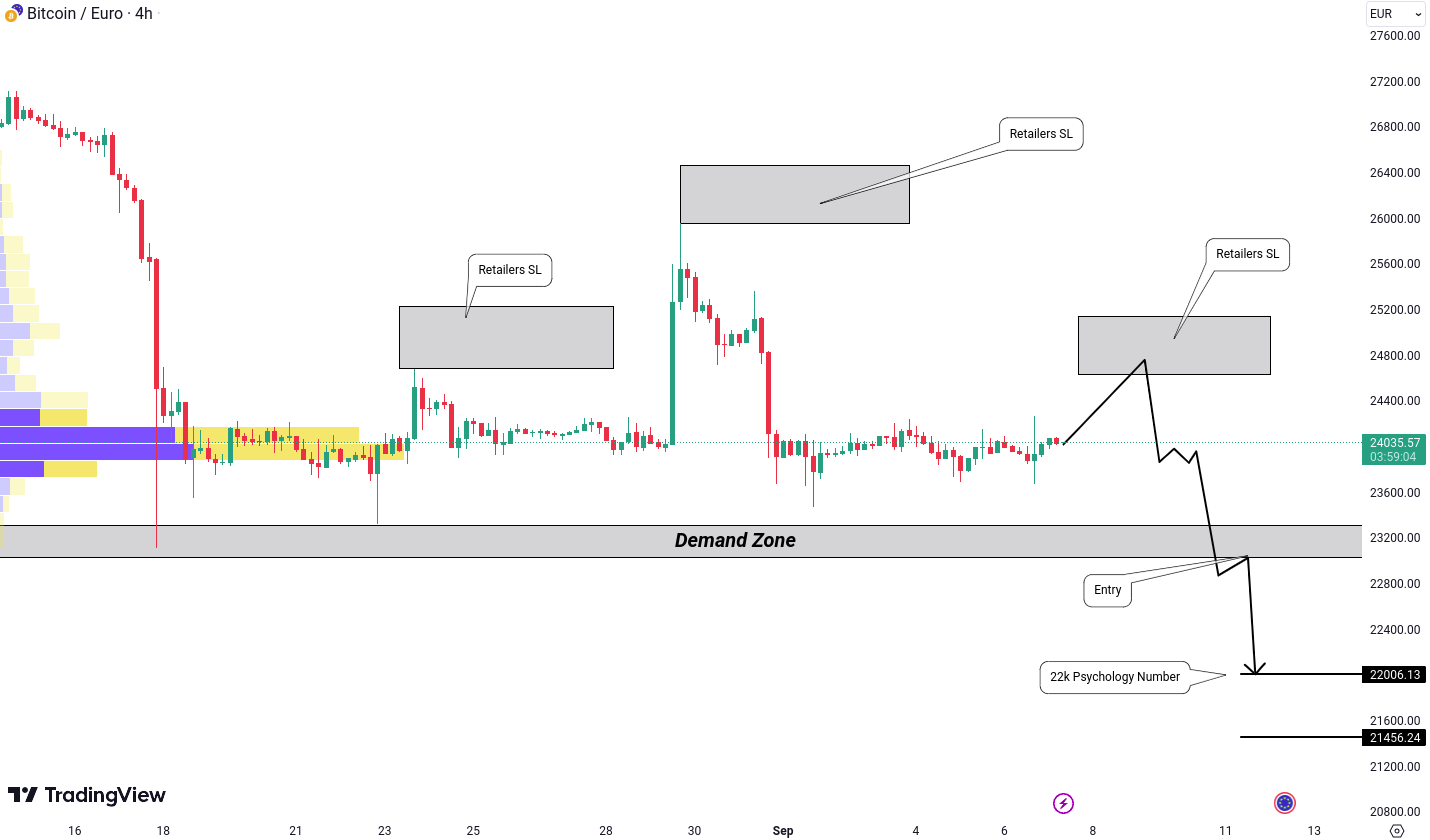
On the 4-hour chart of BTC/EUR, it seems like Bitcoin has a knack for trapping retail sellers - those traders who panic-sell when prices drop. This happened not once, but twice in recent times.
Head and Shoulders
Adding to the bearish sentiment is the head and shoulders pattern we previously discussed. This classic chart formation is often seen as a sign of an impending downtrend.
The Confirmation We Need
Now, we’re looking for confirmation of this bearish outlook. For the bears to take control, we need to see a breakdown below the 23,000 level. It’s not only a psychological milestone but also a zone of high trading volume.
Bearish Targets
If we get that breakdown, traders might set their sights on two primary bearish targets. First, there’s the 22,000 level, which holds its own psychological significance. Below that, we have our eyes on 21,456.
In the unpredictable world of crypto, traders know that confirmation is key. So, keep a close watch on that 23,000 level. This could be the crucial moment that determines whether the bears or the bulls will dominate soon.
Now, let’s step back a little and examine the ETH/EUR chart from a weekly standpoint. What’s happening here could have some important implications.
Ethereum (ETH)
The Long-Term Support
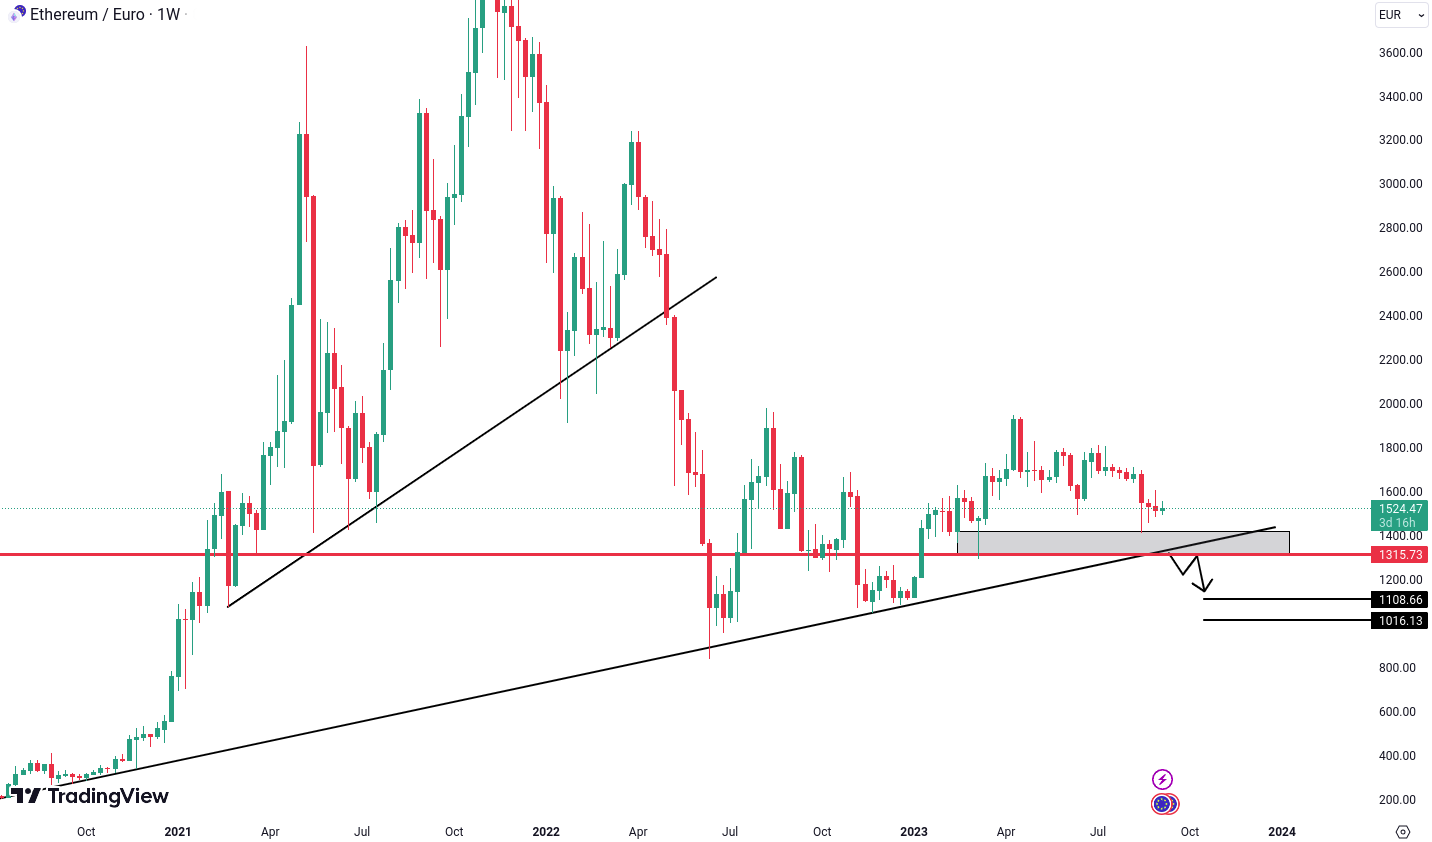
One of the standout features on the weekly chart is the long-term supportive trendline that Ethereum has been dancing around for a considerable amount of time. This trendline has played a crucial role in guiding ETH’s price action.
The Bearish Scenario
But Ethereum isn’t in the clear just yet. To confirm a bearish sentiment, we’re closely watching for a breakdown below the Higher Low (HL) level of 1,315 EUR. A break below it would indicate a possible downtrend in the making.
Bearish Targets
In the event of such a breakdown, traders might start considering two key bearish targets. The first target sits at 1,108 EUR and the second one is at 1,016 EUR. These could be pivotal areas to watch if the bearish sentiment indeed takes hold.
As with any market analysis, it’s important to remember that things can change rapidly in the world of cryptocurrency. Keep a close eye on that 1,315 EUR level – it could be the key to understanding whether the bears or bulls will be dominating Ethereum’s price action in the coming weeks.
MultiversX (EGLD)
The Engulfing Candle
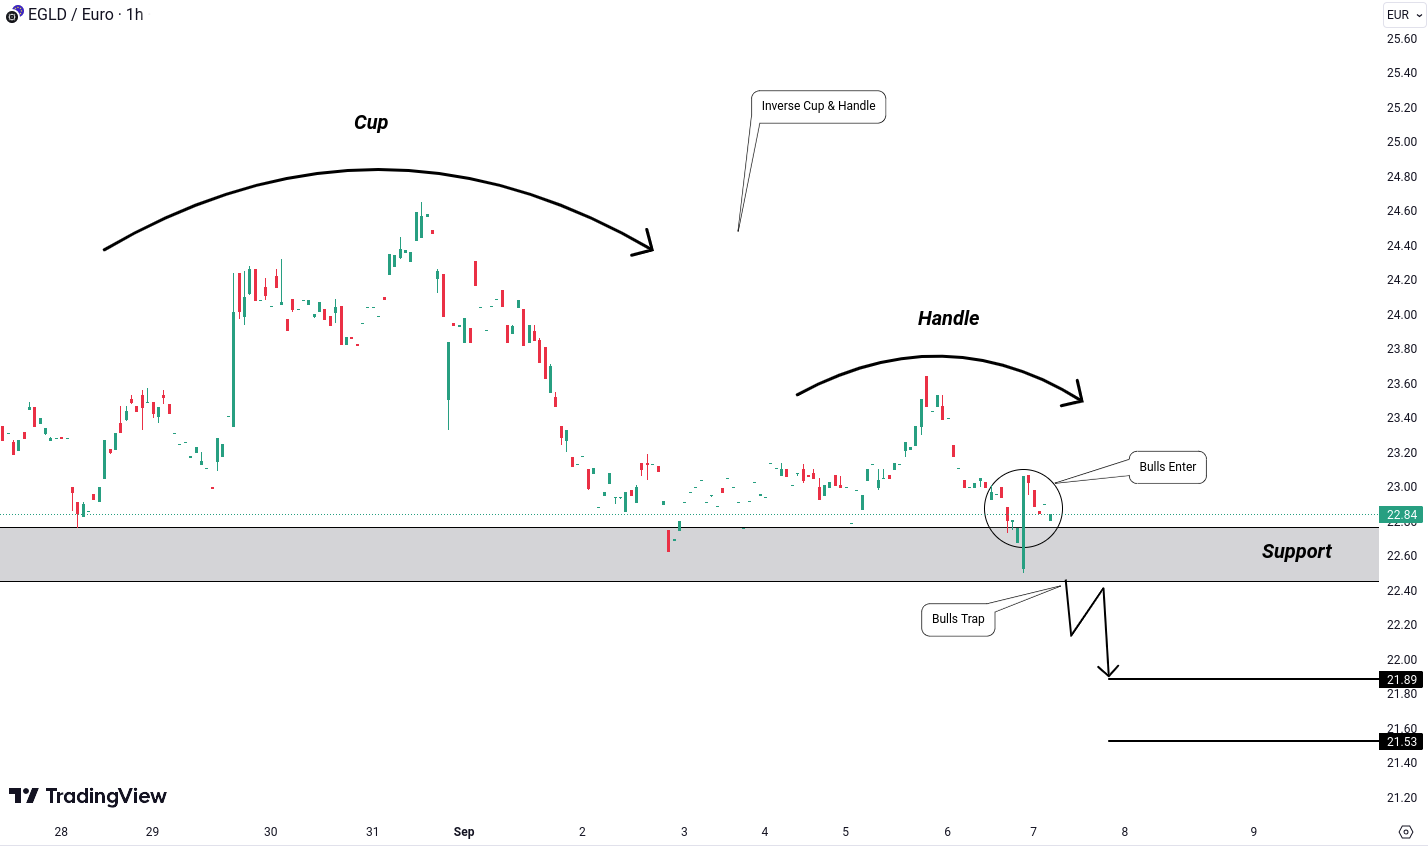
One of the standout developments is the emergence of a substantial bullish engulfing candlestick on the chart. This candlestick has materialized right around a key support level. What does this signify? It suggests that bullish positions are being taken in this zone.
The Make-or-Break Moment
However, it’s not all bullish signals. Zooming out, we can also identify the formation of an inverse cup and handle pattern. For traders, this is an important signal as it often foreshadows bearish moves.
Bearish Outlook
The key level to watch here is 22.44 EUR. If the price breaks below this crucial threshold, it could be seen as a confirmation of bearish sentiment. In this scenario, traders may start looking at two notable targets: 21.89 EUR and 21.53 EUR.
Decentraland (MANA)
The Triangle Takes Shape
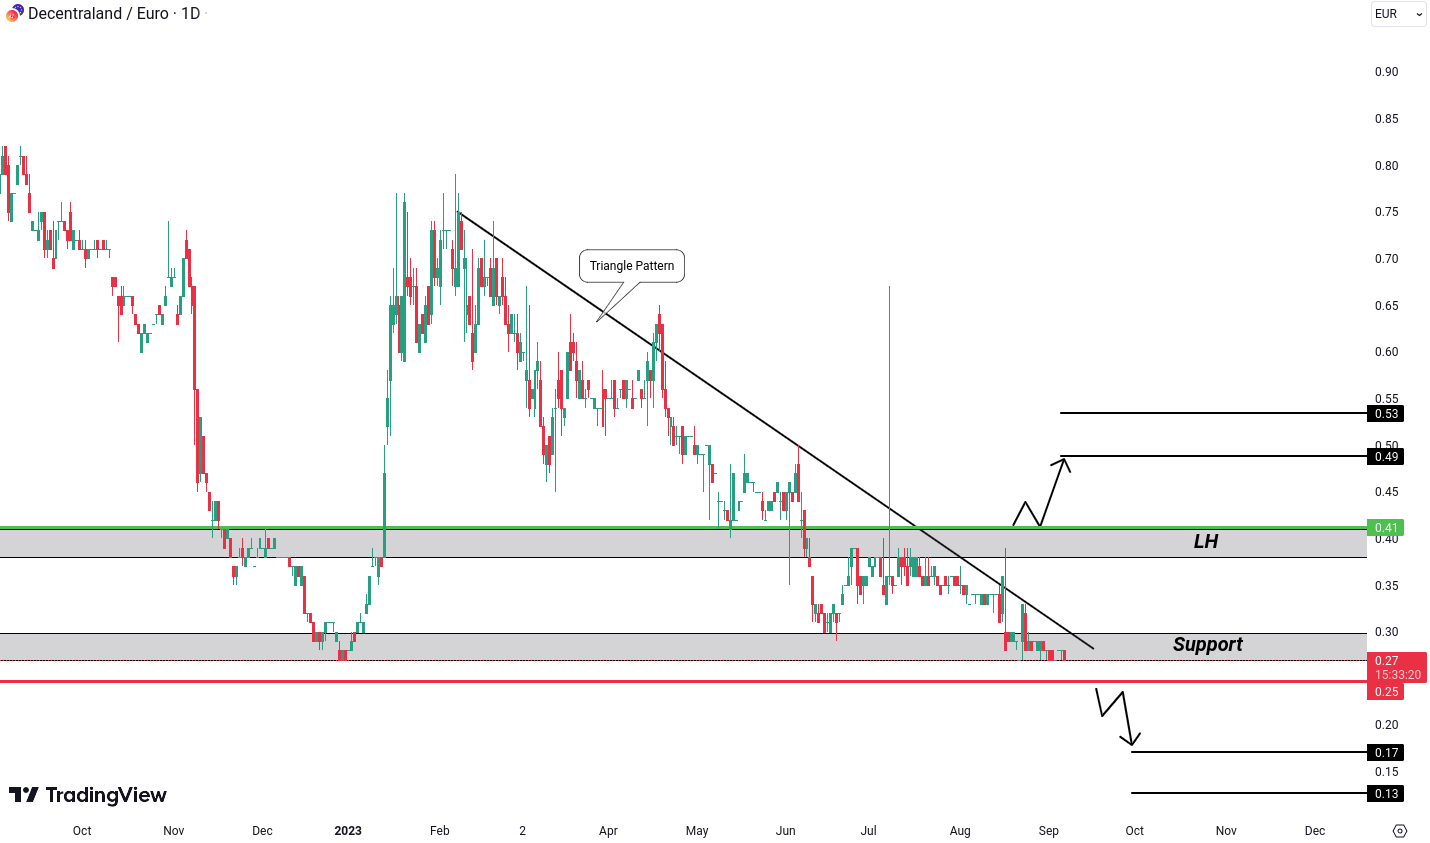
Zooming in on the daily timeframe, a triangle pattern comes into view. The price action has been consolidating, forming higher lows and lower highs within the confines of this triangle. Traders are keenly observing this structure, waiting for a potential breakout or breakdown.
The Support Conundrum
Right now, the price is resting near a critical support level at 0.25 EUR. This level has served as both a launchpad for bullish moves and a barrier for bearish ones. It’s a pivotal moment for MANA.
The Make-or-Break Scenario
For traders looking for a bearish signal, the magic number is 0.25 EUR. If this support level gives way, it could open the door to further declines, with possible targets at 0.17 EUR and 0.13 EUR.
A Glimpse of Optimism
On the flip side, a bullish turn of events might materialize if the price breaks out above the upper trendline of the triangle, ideally accompanied by a breach of the previous lower high at 0.41 EUR. Such a breakout could pave the way for optimistic targets of 0.49 EUR and 0.53 EUR.
Dogecoin (DOGE)
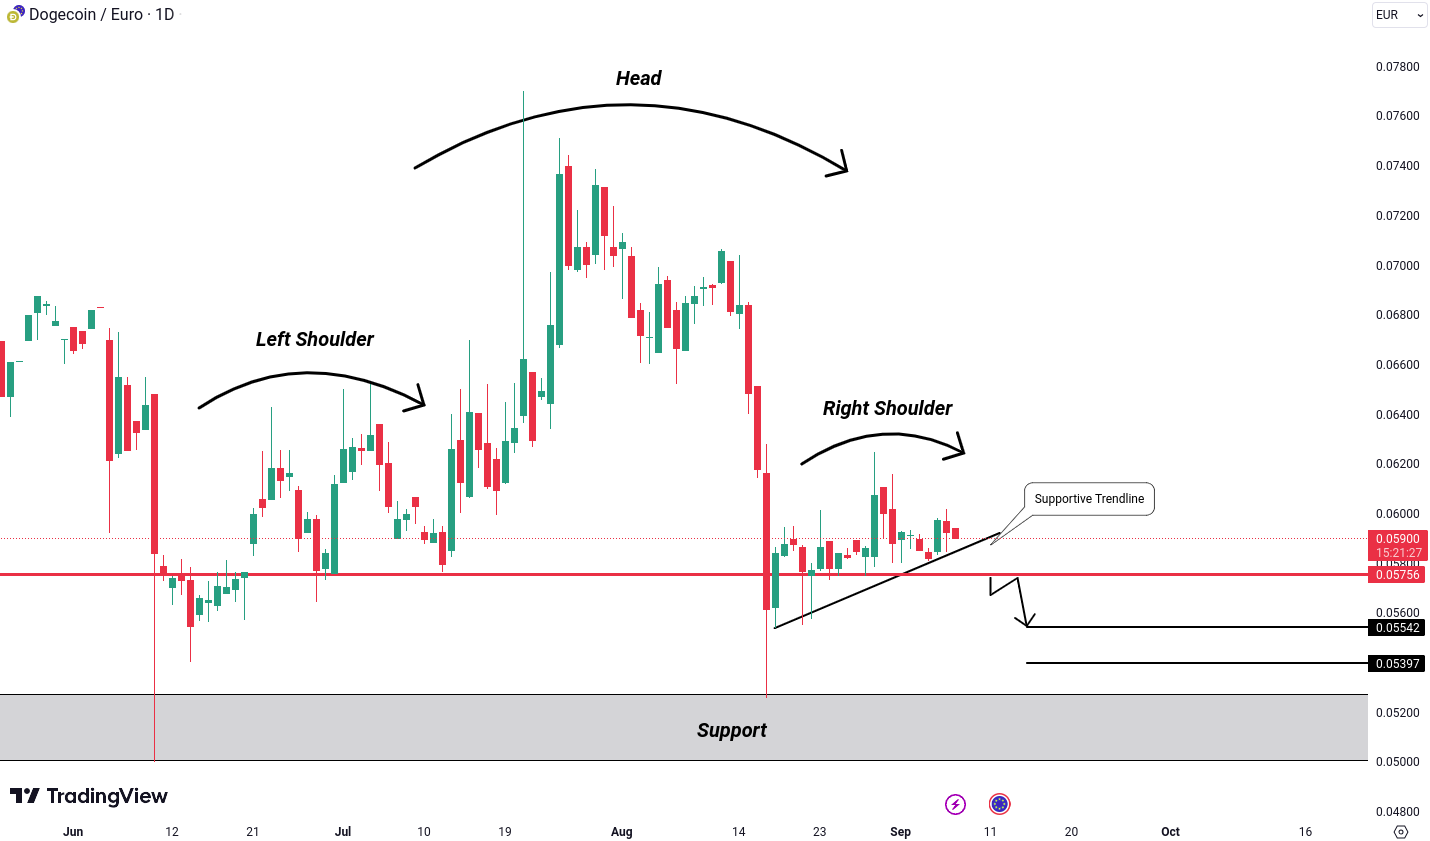
The Head and Shoulder Formation
In the world of technical analysis, patterns can often provide vital clues about future price movements. DOGE/EUR is currently tracing out a classic Head and Shoulders pattern. This pattern generally indicates a potential reversal from a bullish trend to a bearish one.
The Right Shoulder’s Trendline
What adds an interesting twist to this pattern is the trendline forming at the right shoulder. This line can be seen as a potential level of support or resistance, depending on how DOGE/EUR interacts with it.
Waiting for the Break
For traders, the pivotal moment hinges on a crucial level at 0.05756 EUR. If the price decisively breaks below this threshold, it could set the stage for further declines. Potential targets in such a scenario could include 0.05542 EUR and 0.05397 EUR. Beyond these levels lies another critical support level that could determine DOGE/EUR’s future path.
Stay Tuned
As the price action unfolds, we’ll be closely monitoring DOGE/EUR for any significant developments. If the mentioned levels come into play, we’ll be here to provide you with updated scenarios and insights.
Limitation of Liability
This report issued by Tradesilvania is purely informative and is not intended to be used as a tool for making investment decisions in crypto-assets. Any person who chooses to use this report in the process of making investment decisions assumes all related risks. Tradesilvania SRL has no legal or other obligation towards the person in question that would derive from the publication of this report publicly.
The content provided on the Tradesilvania website is for informational purposes only and should not be considered as investment advice, financial advice, trading advice, or any other form of advice. We do not endorse or recommend the buying, selling, or holding of any cryptocurrency. It is important that you conduct your own research and consult with a financial advisor before making any investment decisions. We cannot be held responsible for any investment choices made based on the information presented on our website.
The information in this report was obtained from public sources and is considered relevant and reliable within the limits of publicly available data. However, the value of the digital assets referred to in this report fluctuates over time, and past performance does not indicate future growth.
Total or partial reproduction of this report is permitted only by mentioning the source.