Crypto Market update 1 September 2023

Crypto Market in the last 24h
📉 Global crypto market cap: €965.4B (↓ 3.42%)
📈 24-hour crypto market volume: €35.08B (↑ 35.85%)
💼 DeFi volume: €2.35B (6.71% of total)
💰 Stablecoins volume: €33.35B (95.05% of total)
🚀 Bitcoin dominance: 48.39% (↓ 0.45%) 📉
Bitcoin (BTC)
BTC/EUR Pair: A Focus for Crypto Investors
The BTC/EUR trading pair has consistently captured the attention of cryptocurrency traders. In this article, we will delve into recent price movements, explore emerging trends, and provide valuable insights to help traders make informed decisions in this ever-evolving market.
Recent Price Movements and Targets
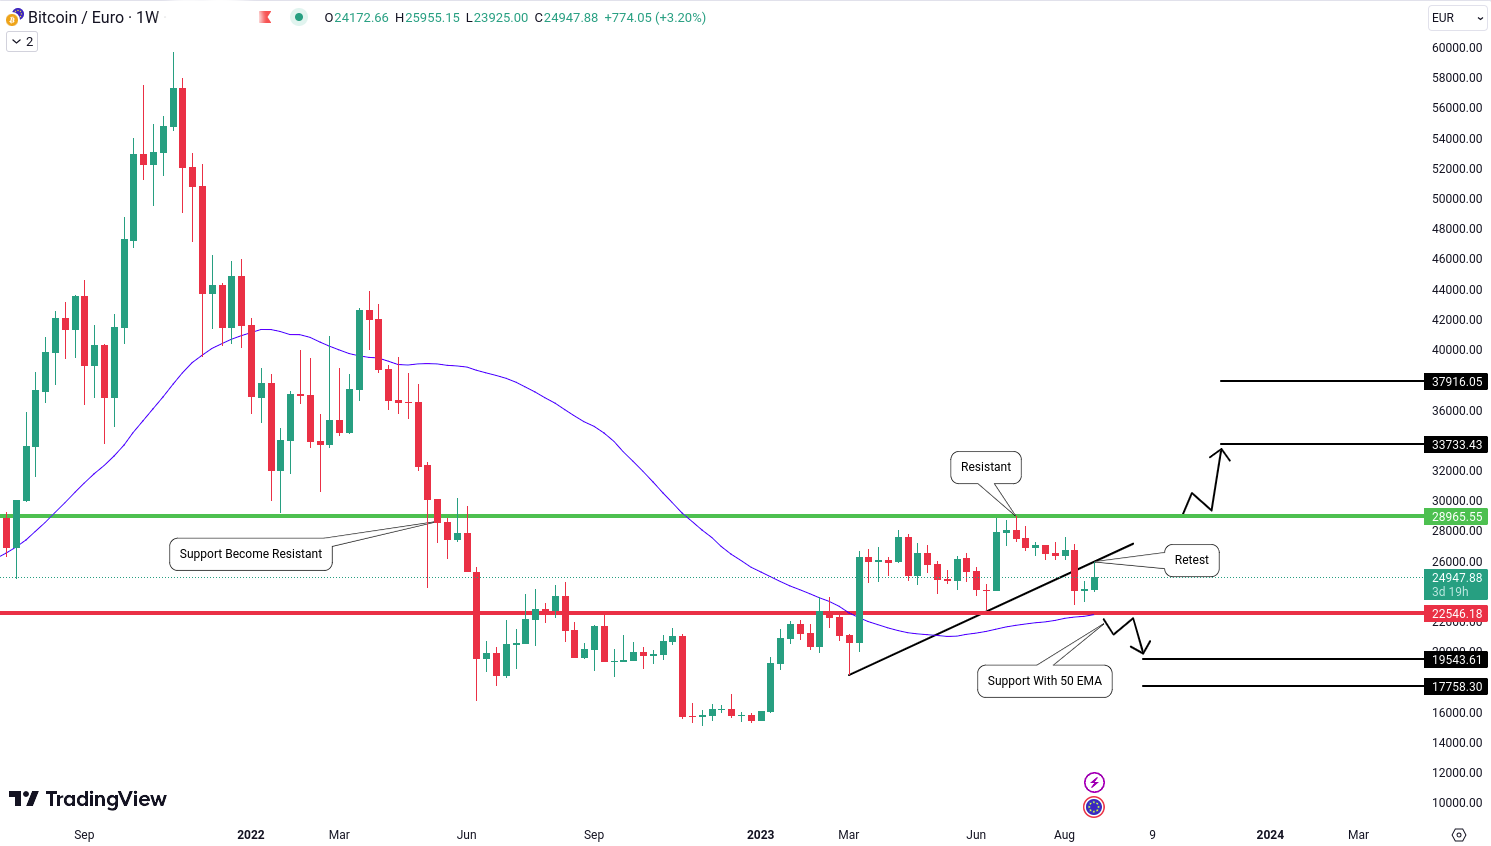
BTC/EUR has seen significant activity recently, successfully achieving our initial target with a brief bullish surge. Although the second target came close, it's crucial to consider the broader market context.
The Weekly View: Retesting Significant Levels
Taking a closer look at the weekly timeframe, we can observe BTC/EUR retracing against a notable trendline. This retracement introduces the potential for sideways movement as we await confirmation of the market's direction.
Potential Scenarios: Bullish and Bearish Outlooks
Like any financial market, BTC/EUR presents various potential scenarios. Let's explore the two primary possibilities:
- Optimistic Breakout: A successful breakout above the resistance level at €28,965, previously a support level, could pave the way for a robust bullish momentum. Such a breakout might lead to promising targets at €33,733 and €37,916.
- Bearish Momentum: Conversely, a drop below the support level and the critical 50-day Exponential Moving Average (EMA) at €22,546 could trigger a bearish sentiment. In such circumstances, traders might anticipate targets around €19,543 and €17,758.
Ethereum (ETH/EUR): Analyzing Trends
Ethereum's ETH/EUR trading pair has garnered significant attention, prompting us to examine recent developments and potential scenarios.
Weekly Patterns: The M Formation
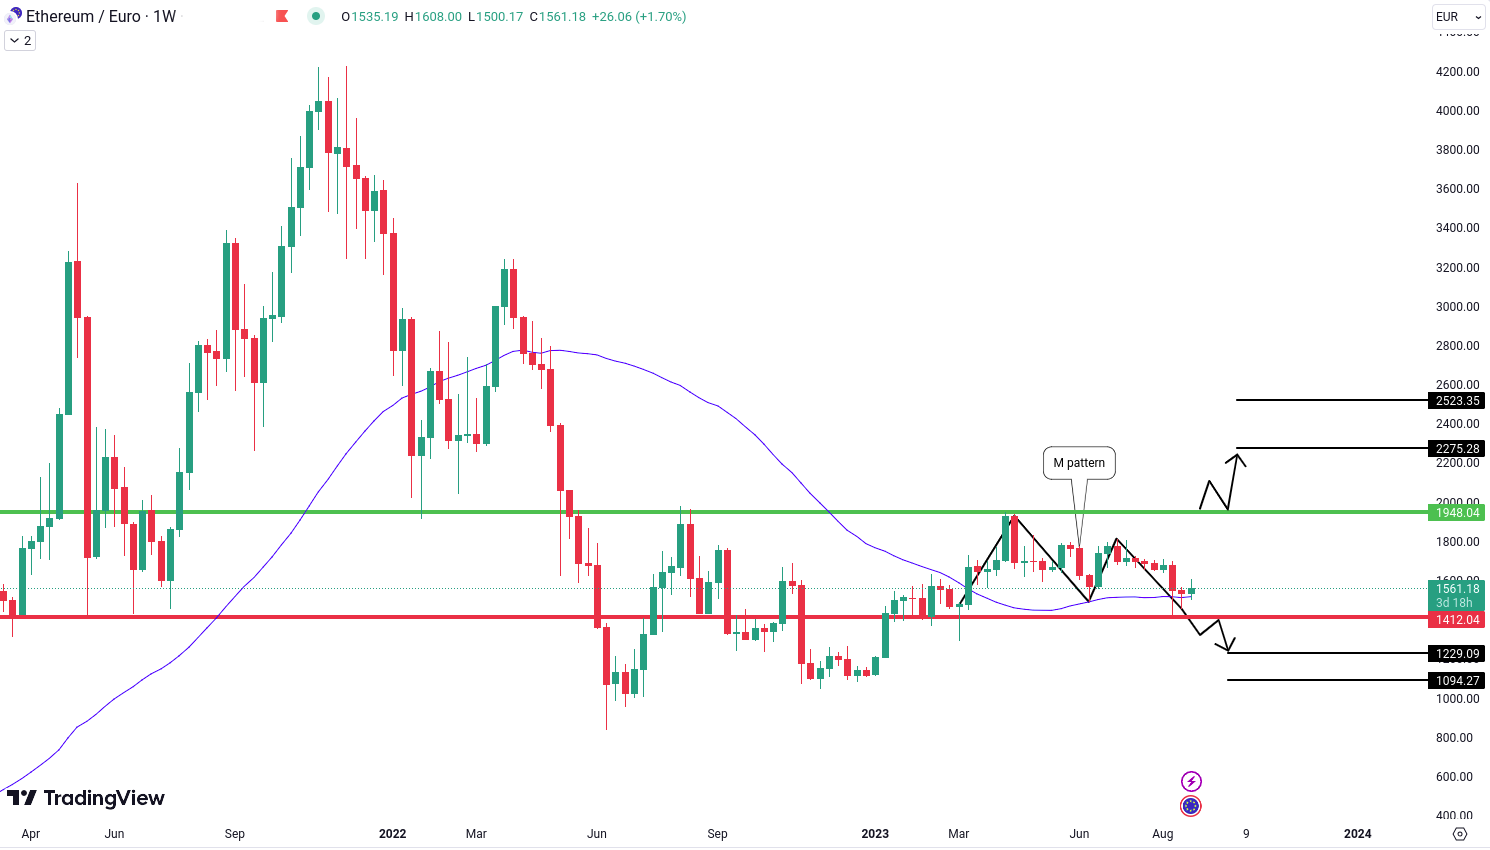
The weekly timeframe for ETH/EUR reveals the emergence of an M pattern, a classic bearish indicator. This formation suggests the possibility of a forthcoming downtrend. However, it's essential to assess both sides of the market before making any trading decisions.
Bearish Scenario: Breaking Down Support
If ETH/EUR breaks below the support level at €1,412, it could signal a bearish movement. Traders should be prepared for the price to potentially dip further, with potential targets around €1,229 and €1,094. This bearish outlook aligns with the M pattern formation.
Bullish Prospect: Overcoming Resistance
On the other hand, an upward price movement could invalidate the M pattern. If ETH/EUR manages to break through the resistance level at €1,948, a bullish trend might emerge. Such a breakout could drive the price higher, with potential targets situated around €2,275 and €2,523.
EGLD/EUR: Assessing Market Sentiment
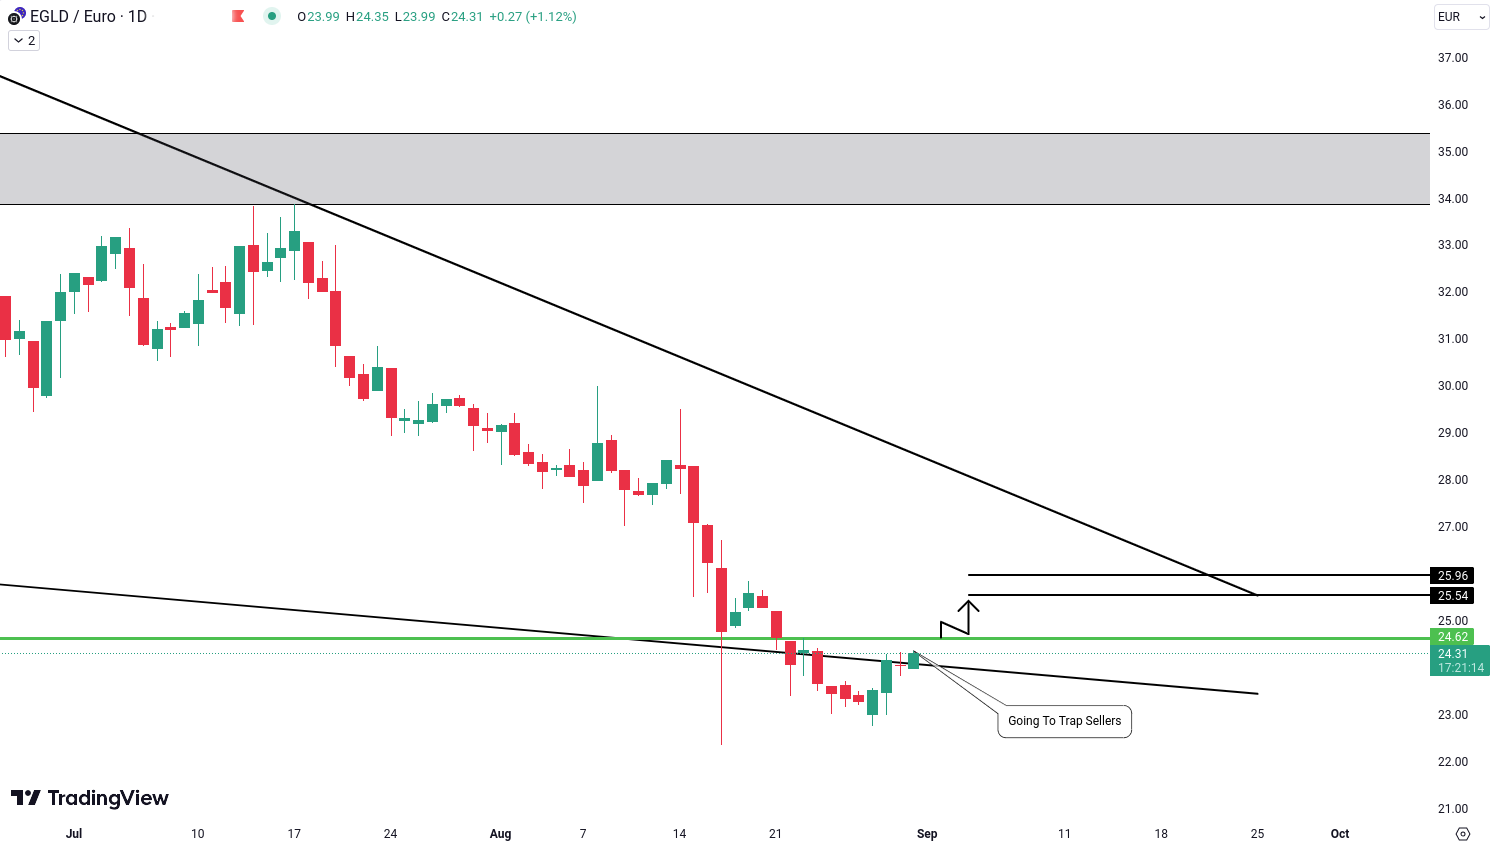
Currently, EGLD/EUR is undergoing a price movement involving the breakdown of the lower trendline of a falling wedge pattern. What adds intrigue to this situation is the subsequent return of the price back within the falling wedge pattern, suggesting a potential shift in market sentiment.
Bullish Momentum: Awaiting the Breakout
If EGLD/EUR successfully breaches the resistance level at €24.62, it could signal the beginning of a bullish movement. The dynamic where sellers become trapped within the falling wedge pattern might fuel this upward trend. Traders could anticipate potential targets around €25.54 and €25.96 as the price aims to capitalize on the bullish sentiment.
Cardano (ADA/EUR): Examining a Unique Pattern
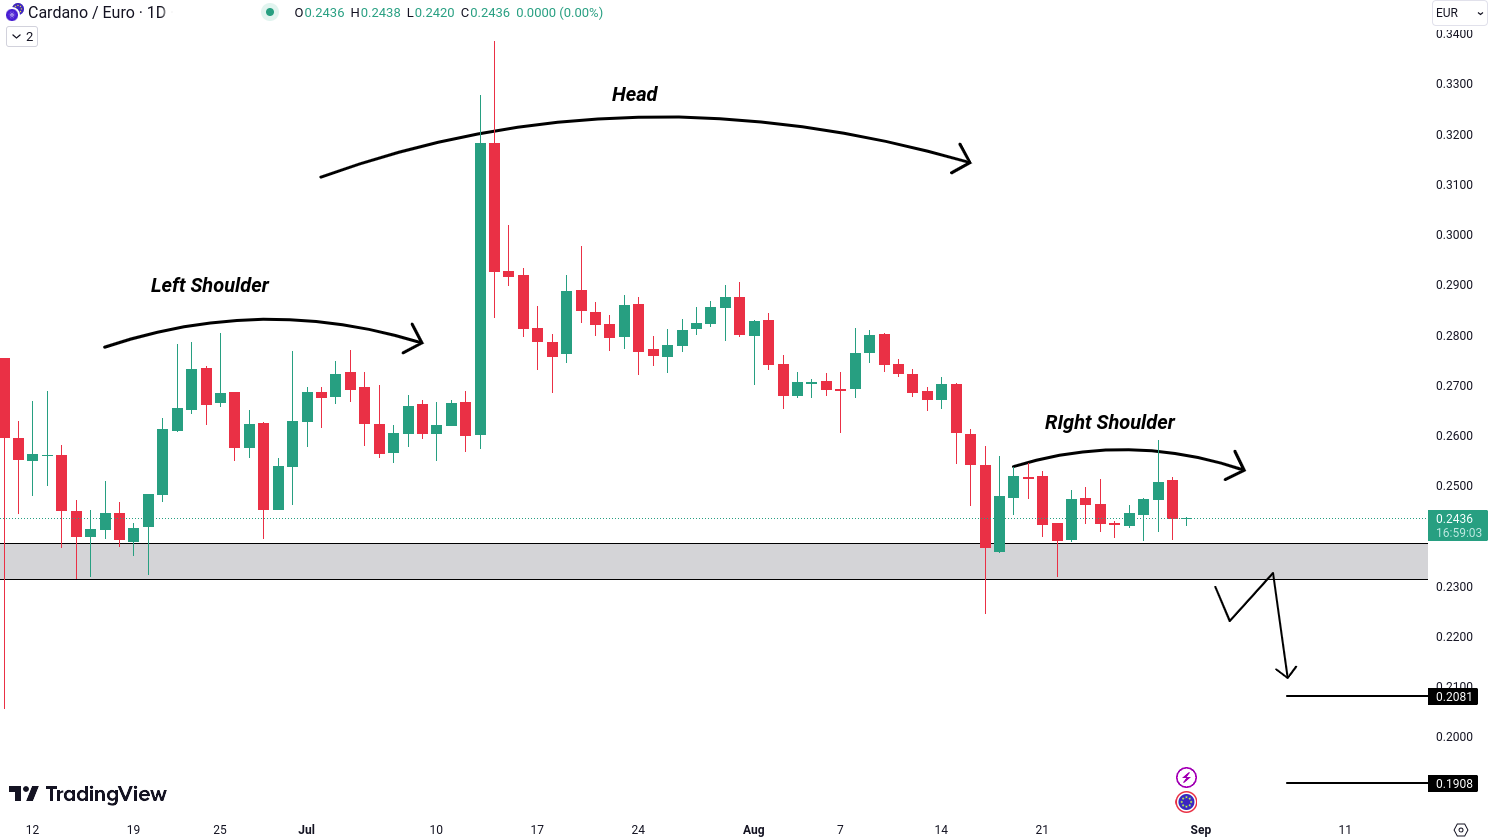
ADA/EUR has taken an intriguing turn in its price movement, with a head and shoulders pattern emerging on the daily timeframe.
Understanding the Head and Shoulders Pattern
The head and shoulders pattern is a well-known technical formation that often indicates a reversal in market trend. It consists of three peaks, with the middle peak being the highest (the "head"), and the two surrounding peaks forming the "shoulders." The "neckline" is drawn by connecting the lows between the shoulders.
Breaking Down Potential Bearish Movement
If ADA/EUR manages to break below the neckline and support level of €0.2302, it could trigger a bearish movement. This breakdown would validate the head and shoulders pattern and might lead to further downward momentum. Traders should prepare for potential targets around €0.2081 and €0.1908 as the price explores lower levels.
Ripple (XRP/EUR): A Steady Path Forward
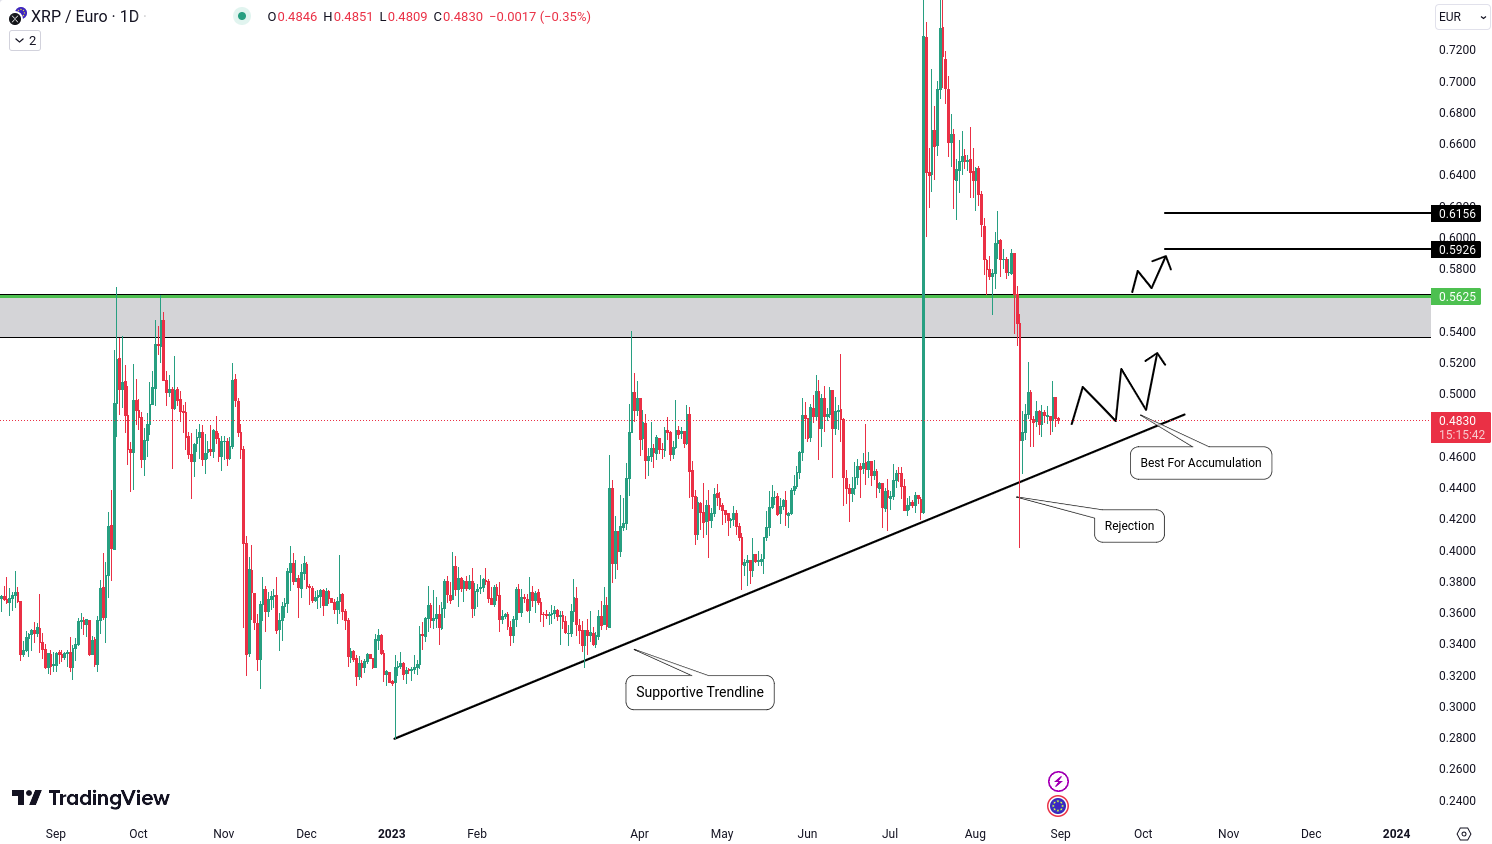
XRP/EUR has maintained a consistent relationship with its supportive trendline over an extended period, showcasing a robust foundation for its price movement.
Supportive Trendline: A Reliable Reference Point
XRP/EUR's steadfast adherence to its supportive trendline has not gone unnoticed. This trendline, which has played a significant role in guiding price action, has once again demonstrated its importance as the price finds support and consolidates around this critical level. This consolidation phase presents an intriguing opportunity for investors looking to accumulate positions for the long term.
Exploring Consolidation and Accumulation
The recent rejection of price movement from the supportive trendline offers valuable insights into the ongoing consolidation process. This period of consolidation is often viewed as a time for accumulation, where traders and investors strategically build their positions in anticipation of potential future movements.
The Bullish Breakout Scenario
As the price consolidates near the supportive trendline, traders should closely monitor the resistance level at €0.5625. A breakout above this resistance level could signal a bullish shift in momentum. If XRP/EUR successfully breaks this resistance, it opens the door to potential gains, with initial targets set around €0.5926 and €0.6156.
Please note that these analyses are for informational purposes only and should not be considered as financial advice. Cryptocurrency markets are highly volatile, and it's essential to conduct thorough research and consult with a financial advisor before making any investment decisions.