Crypto Market update 12 July 2023

Crypto market evolution in the last 24 hours:
💰Market Cap: €1.08T (↑0.67%)
💼Volume: €23.99B (↓19.18%)
🔥#DeFi: €1.84B (7.67% of volume)
💱#Stablecoins Volume: €21.98B (91.59%)
💪#BTC Dominance: 50.01% (↑0.12%)
Bitcoin (BTC) analysis and update
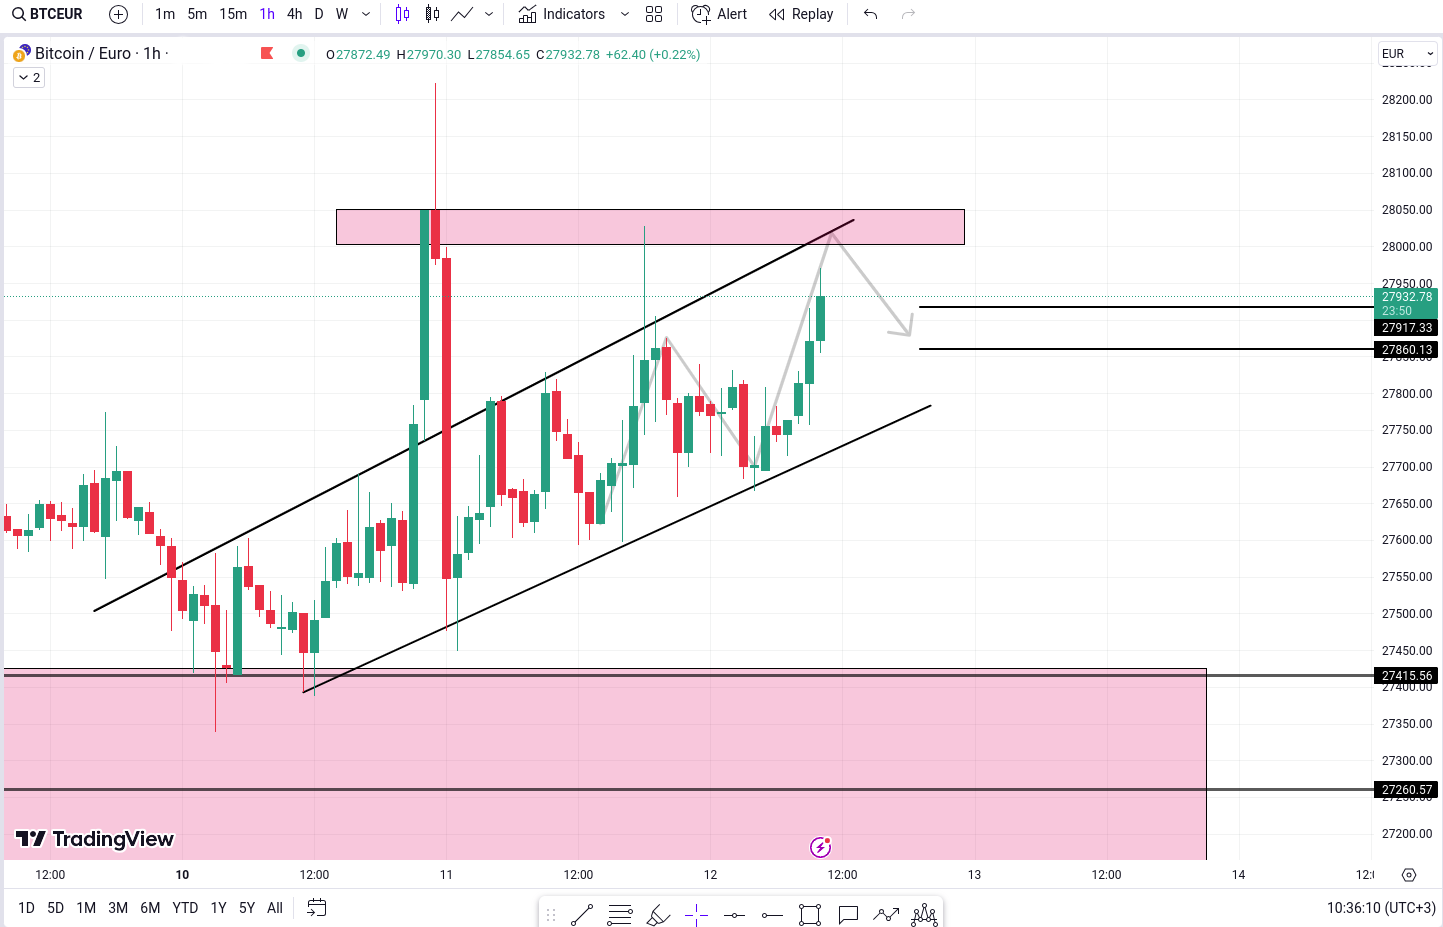
BTC/EUR has been exhibiting a rising edge pattern in recent days, indicating a possible shift in market sentiment. This pattern is characterized by ascending lows and highs, forming a rising channel on the price chart. Traders often interpret this pattern as a precursor to a trend reversal, suggesting that the upward momentum may soon weaken.
Resistance Point Approaching:
A key resistance point is approaching, further emphasizing the significance of the rising edge pattern. Historically, this level has acted as a significant barrier for the price, causing it to reverse or consolidate. Traders closely monitor resistance levels as they can provide valuable insights into potential price movements. In this case, the nearing resistance point increases the likelihood of a reversal from the current zone.
Target Levels for Today:
27,917 Euro and 27,867 Euro:Considering the rising edge pattern and the proximity of the resistance level, it is advisable to set conservative targets for today's trading session. Our analysis suggests that potential price targets for BTC/EUR could be around 27,917 Euro and 27,867 Euro. These levels are chosen with caution, taking into account the smaller price movements typically observed during periods of important news announcements, such as US CPI Data meetings.
Ethereum (ETH) analysis and update
The ETH/EUR pair is demonstrating a notable adherence to its trendline and simultaneously forming a recognizable W pattern.
The pair has consistently been tracking an upward trendline, indicating the prevailing bullish sentiment in the market. Investors continue to display confidence in Ethereum's potential, supporting its upward trajectory.
The W pattern, a chart pattern indicating a potential trend reversal or continuation, is evident in the ETH/EUR pair. This pattern is characterized by two significant lows followed by a higher low, resembling the letter 'W.' Its formation suggests a potential continuation of the bullish trend.
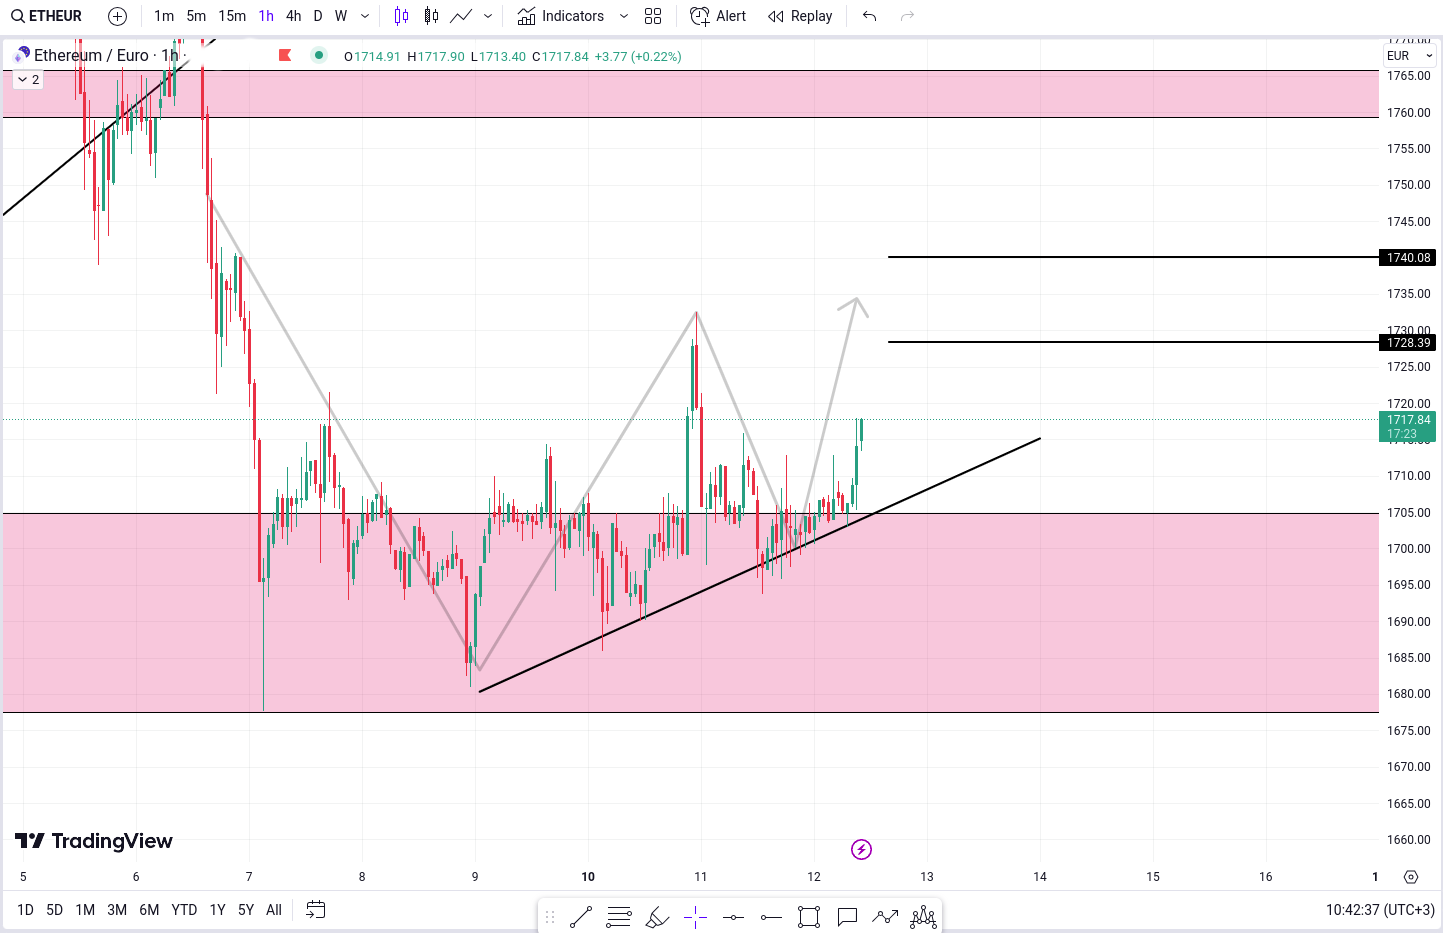
Price Targets: After conducting our analysis, we have identified two potential price targets for ETH/EUR. The first target is set at 1,728 Euro, a crucial level where the pair may encounter resistance. A successful breach of this resistance level would indicate a strong bullish momentum.
The second target is set at 1,740 Euro, representing a significant psychological and technical level. Surpassing this level could further reinforce the bullish case for ETH/EUR, potentially triggering additional buying pressure from investors.
MultiversX (EGLD) analysis and update
EGLD/EUR’s current formation of the flag and pole pattern presents an intriguing opportunity for traders and investors.
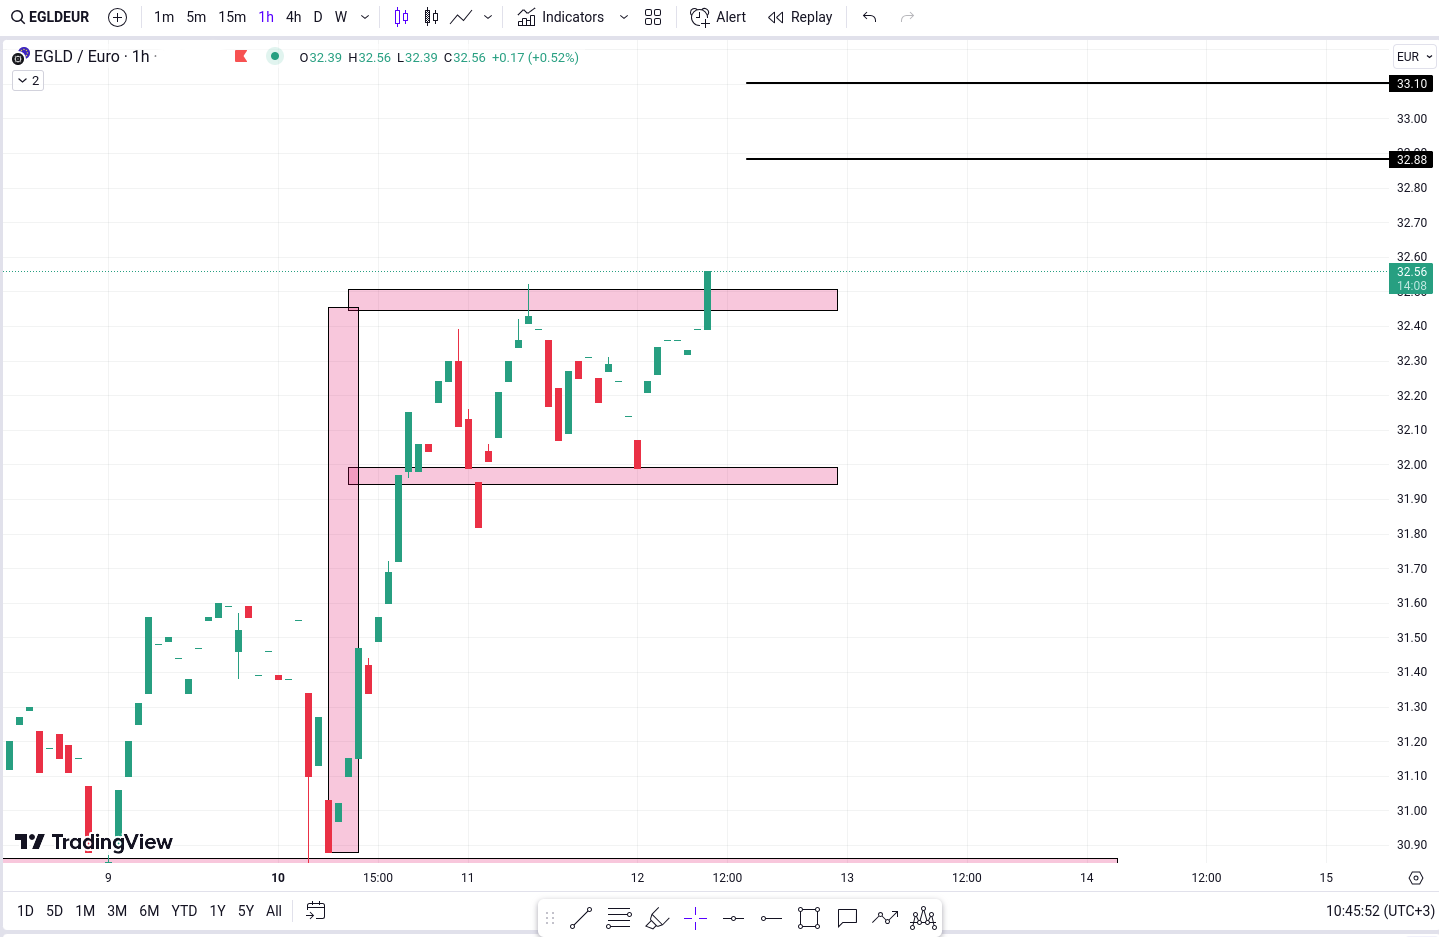
The possibility of a bullish breakout, with targets set at 32.88 Euro and 33.10 Euro, highlights the potential for continued upward momentum. However, a cautious approach is necessary, as a bearish reversal could lead to a downward move with targets set at 32.09 Euro, 32.19 Euro, and 32.27 Euro.
Pepe (PEPE) analysis and update
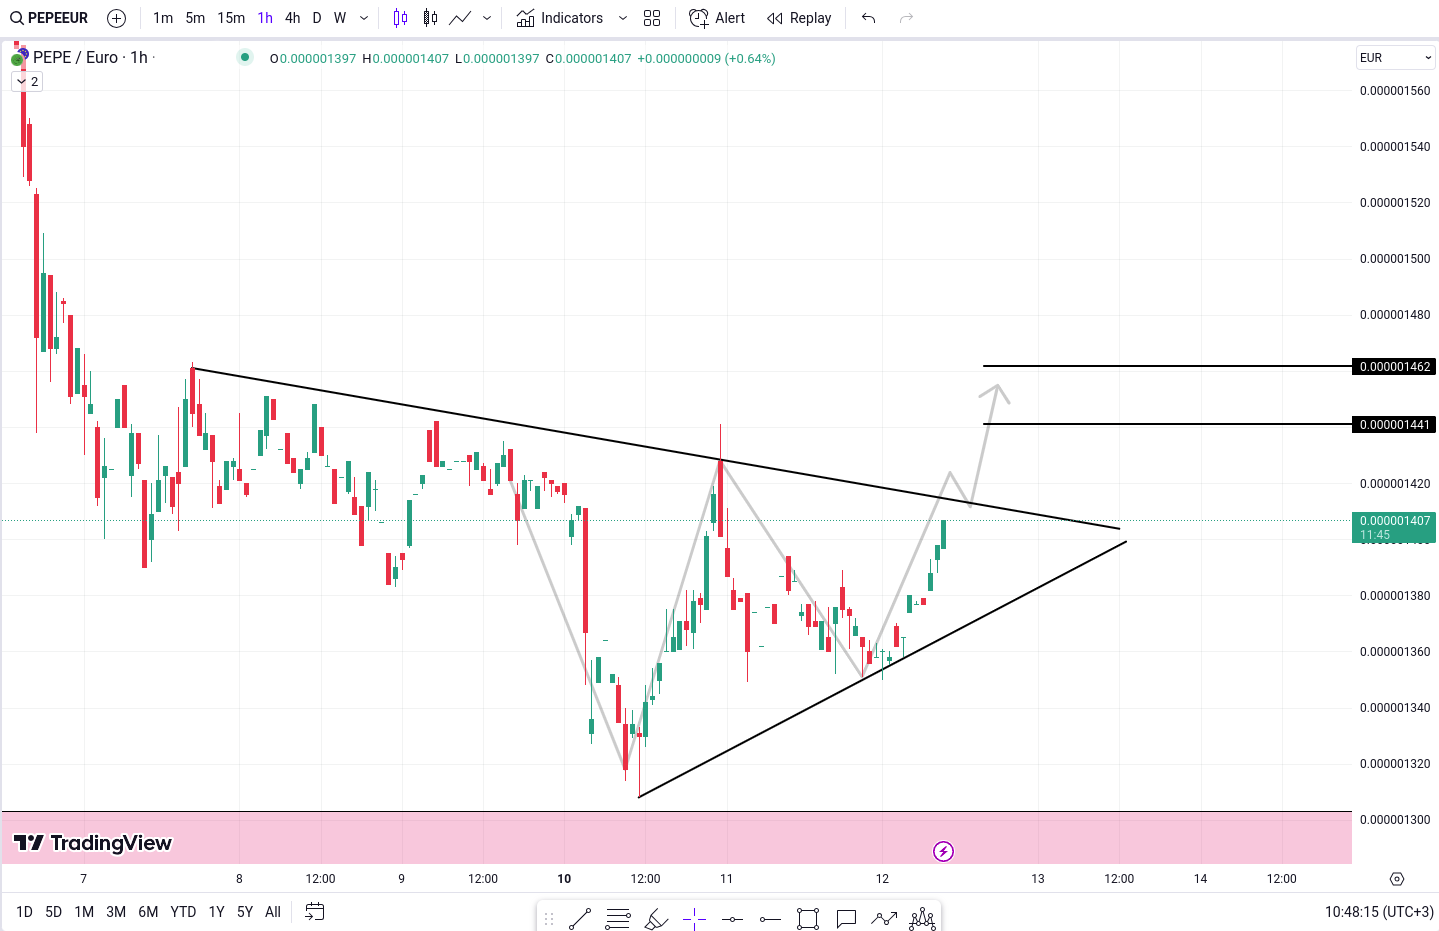
The PEPE/EUR trading pair has exhibited a promising trendline and a formation of a W-shaped pattern, indicating potential target levels of 0.000001441 Euro and 0.000001462 Euro.
Polkadot (DOT) analysis and update
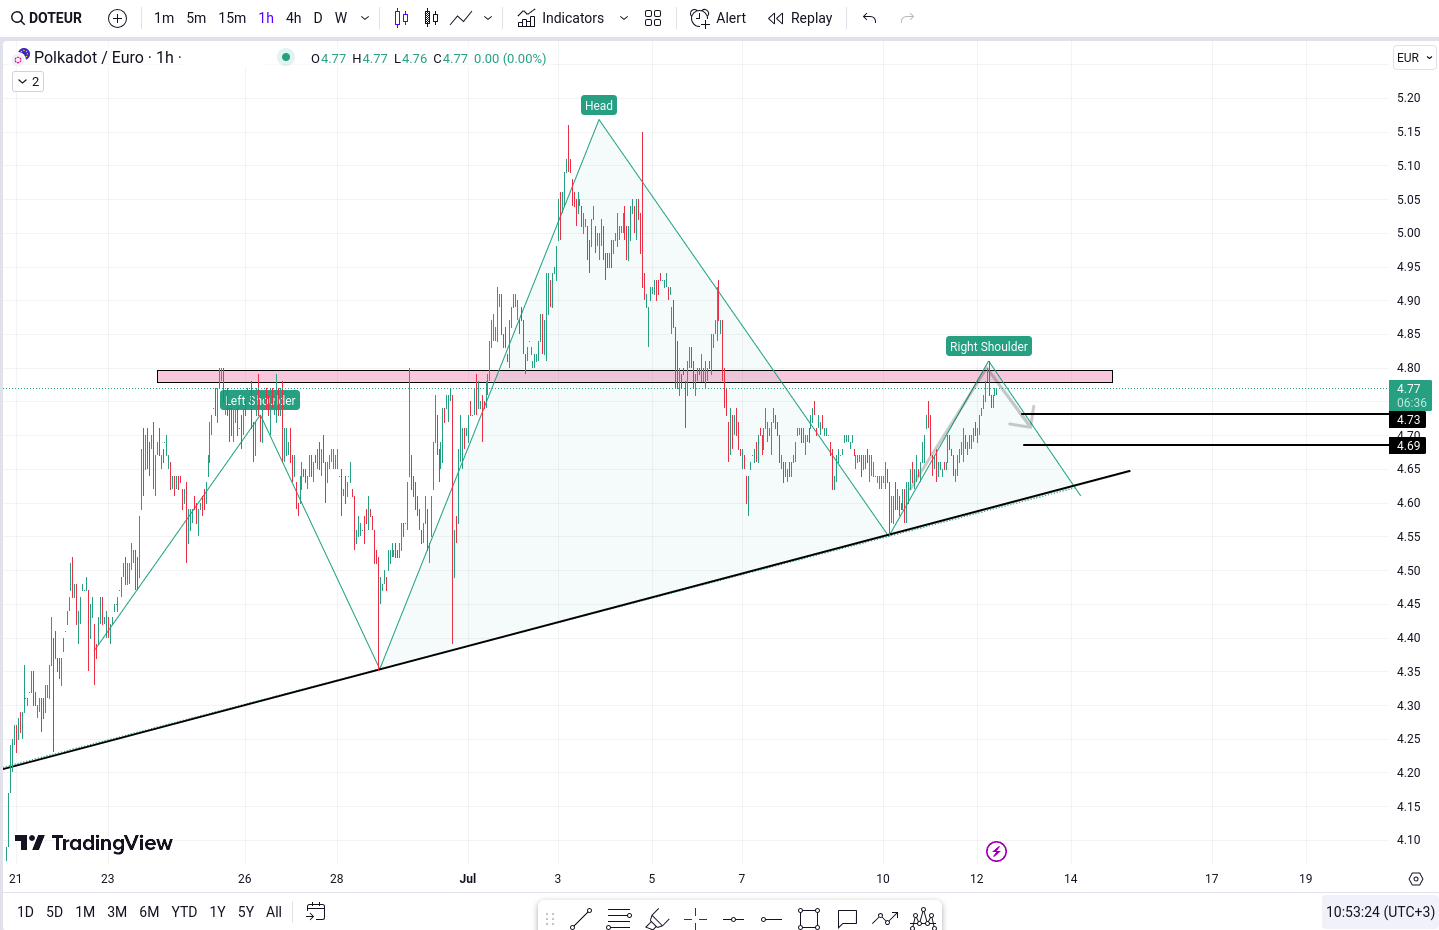
DOT/EUR is currently positioned near a crucial resistance zone while following a trendline that acts as a magnet, drawing the price towards it.
The target levels of 4.76 Euro and 4.69 Euro present potential areas for traders to consider taking profits or adjusting their positions. However, it is crucial to remain vigilant and monitor price action closely, as the possibility of a head and shoulders pattern in a larger time frame may present itself in the future.
Aave (AAVE) analysis and update
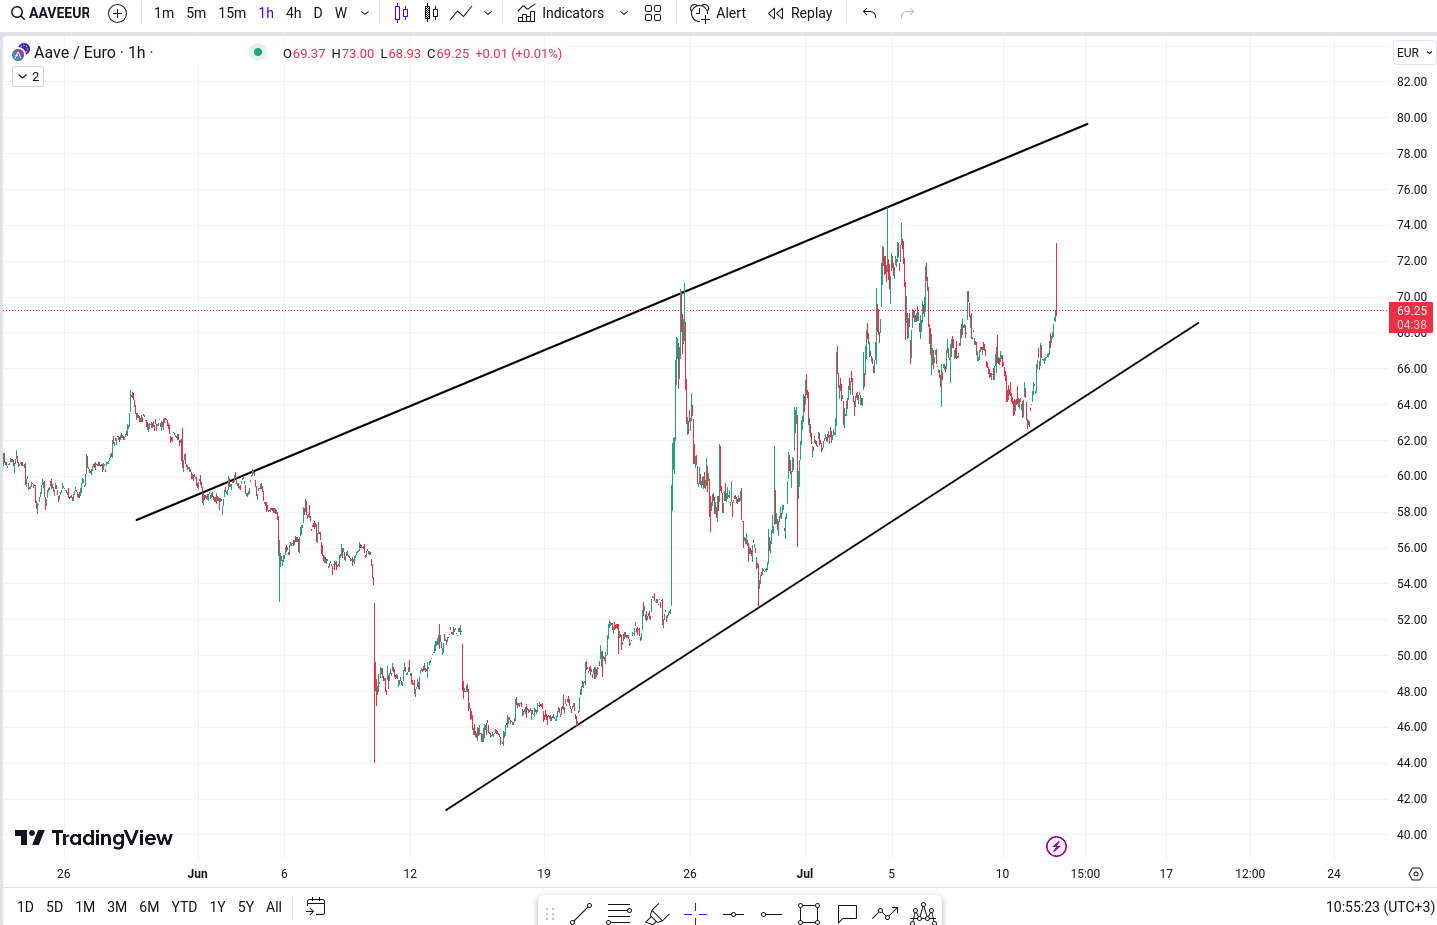
AAVE/EUR’s adherence to the rising wedge pattern raises anticipation for an imminent breakout or breakdown. The direction of the breakout or breakdown will provide important signals regarding the future movement of the pair.
Algorand (ALGO) analysis and update
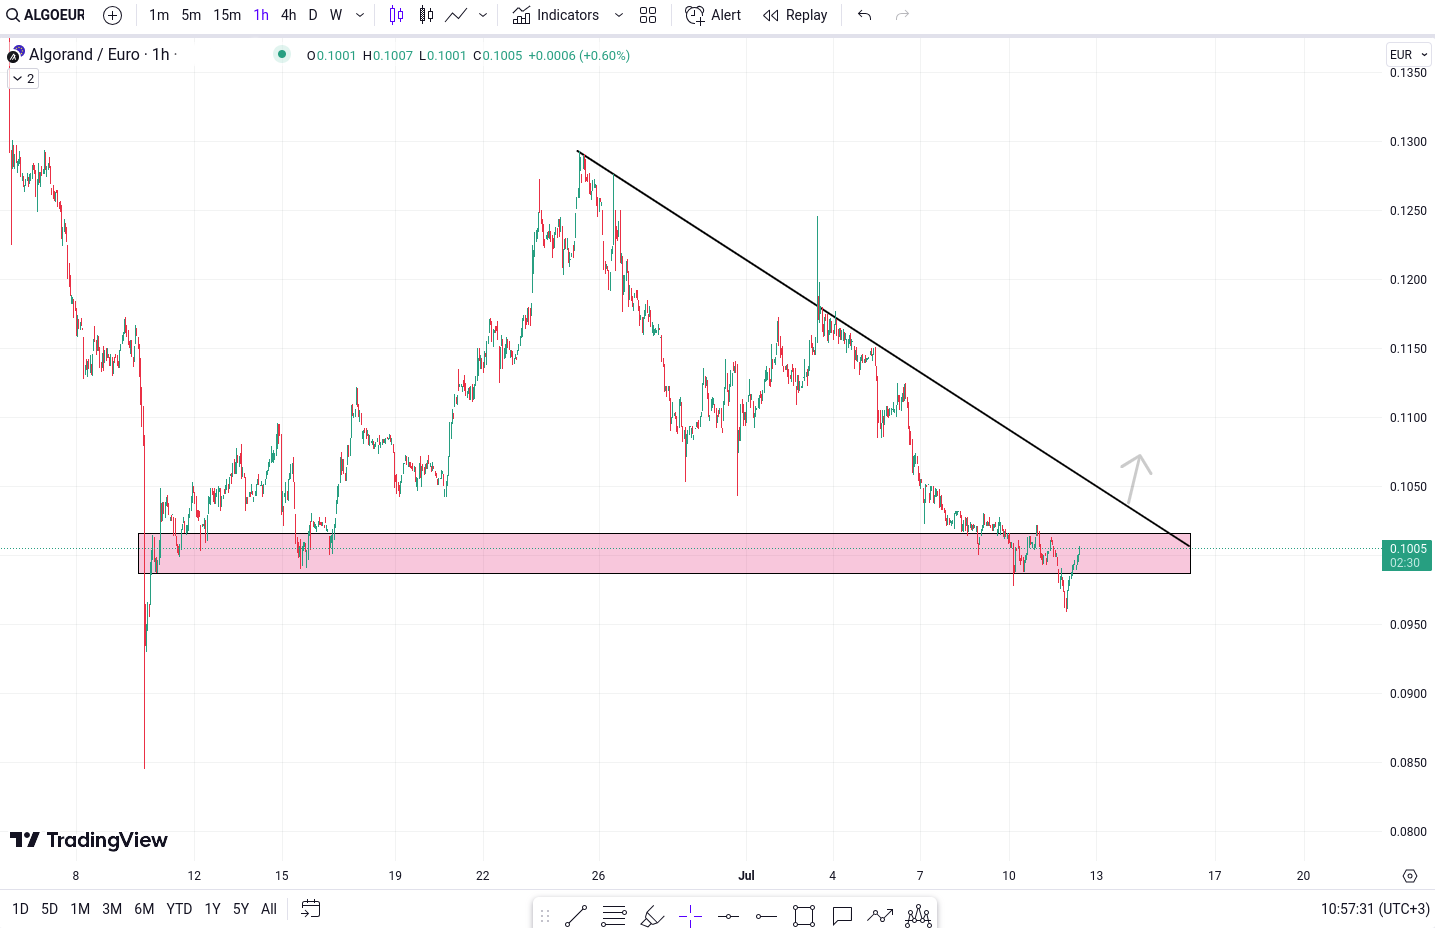
ALGO/EUR recently experienced a breakdown of a triangle pattern. This breakdown has the potential to trap bullish traders, while a breakout above the upper trendline could lead to significant upward movement
Limitation of Liability
This report issued by Tradesilvania is purely informative and is not intended to be used as a tool for making investment decisions in crypto-assets. Any person who chooses to use this report in the process of making investment decisions assumes all related risks. Tradesilvania SRL has no legal or other obligation towards the person in question that would derive from the publication of this report publicly.
The content provided on the Tradesilvania website is for informational purposes only and should not be considered as investment advice, financial advice, trading advice, or any other form of advice. We do not endorse or recommend the buying, selling, or holding of any cryptocurrency. It is important that you conduct your own research and consult with a financial advisor before making any investment decisions. We cannot be held responsible for any investment choices made based on the information presented on our website.
The information in this report was obtained from public sources and is considered relevant and reliable within the limits of publicly available data. However, the value of the digital assets referred to in this report fluctuates over time, and past performance does not indicate future growth.
Total or partial reproduction of this report is permitted only by mentioning the source.