Crypto Market Update - 21 august 2023

24h update:
🌐 The global crypto market cap stands at €964.19B, experiencing a 0.95% decrease in the last day.
💰 The total market volume over the last 24 hours is €23.29B, marking a 7.13% increase.
💱 DeFi contributes €1.68B, making up 7.21% of the total volume.
💲 Stablecoins comprise €22.07B, accounting for 94.74% of the total volume.
⚖️ Bitcoin's dominance: 48.17%, with a daily increase of 0.15%.
Bitcoin (BTC) analysis and update
Recent Trends and Sideways Phase
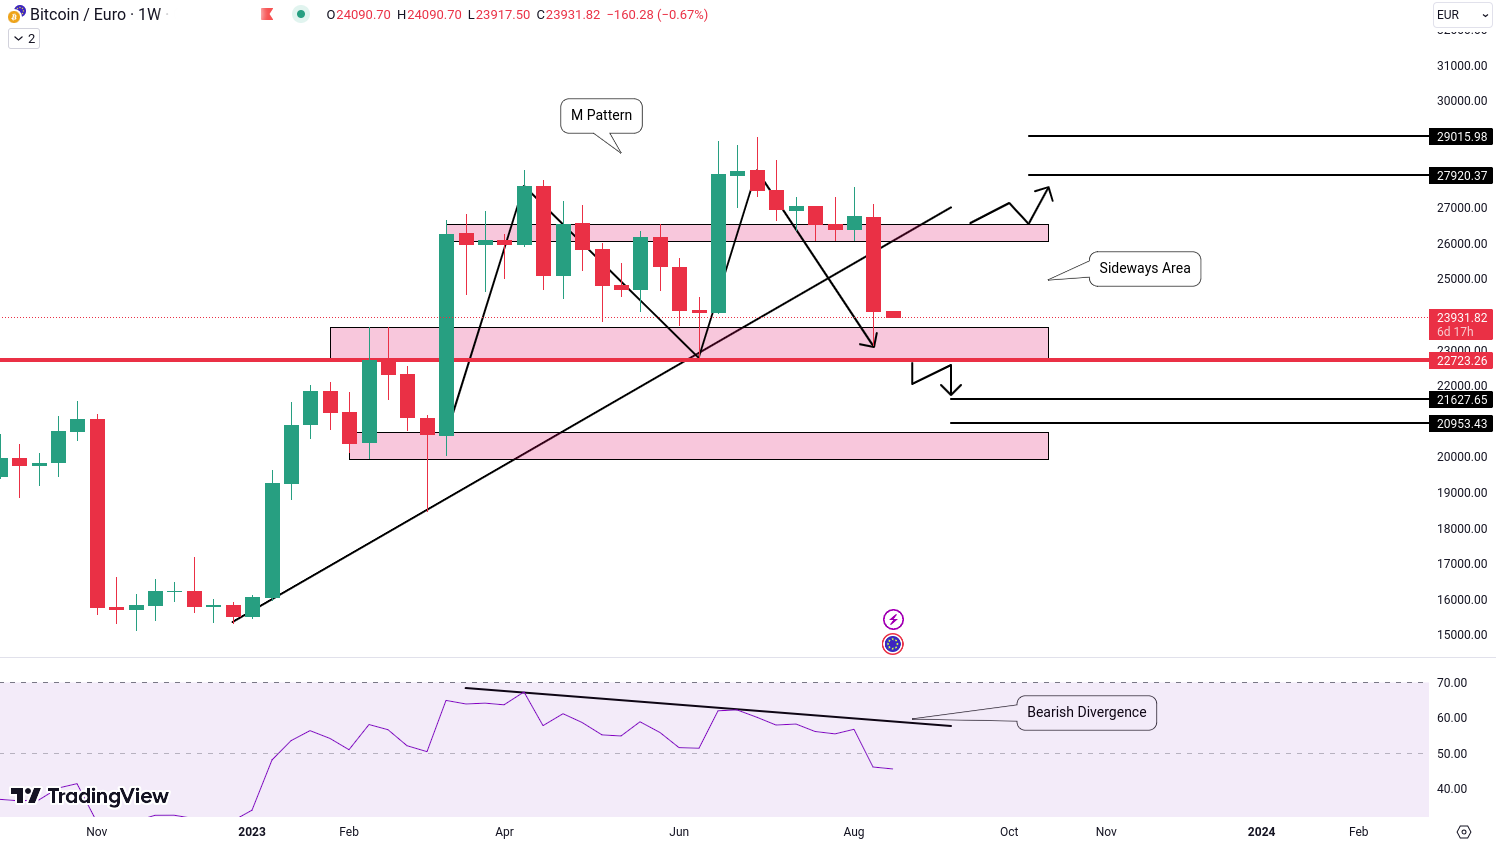
BTC/EUR has successfully achieved the targets we previously outlined, confirming a bearish trend. Now, our attention turns to the potential for a sideways market. It's a common occurrence for BTC to transition into periods of lateral movement following robust bullish or bearish trends. This phase could persist for several weeks or even months, presenting distinct trading challenges and prospects.
Bearish Indicators: M Pattern and RSI Divergence
Upon closer examination of the weekly chart, a noticeable M pattern is taking shape, suggesting the potential for bearish pressure. Additionally, the Relative Strength Index (RSI) demonstrates bearish divergence, indicating a weakening in the upward momentum of the price.
Breakdown Alert: Key Support Level
To validate this bearish perspective, it's essential to closely monitor the level of 22,723 Euro. A breakdown beneath this level of demand would signal a continuation of the bearish movement.
Potential Targets: What to Anticipate
In the event of a breakdown, potential downside targets become relevant. These levels could be approximately 21,627 Euro and 20,953 Euro, aligning with significant demand zones.
A Glimpse of the Bullish Scenario
While the current sentiment leans towards caution, it's imperative to remain receptive to all potential outcomes. Should BTC/EUR succeed in breaking above the 26,490 Euro level, it could usher in a bullish phase. This, in turn, might lead to potential targets around 27,920 Euro and 29,015 Euro.

Ethereum (ETH) analysis and update
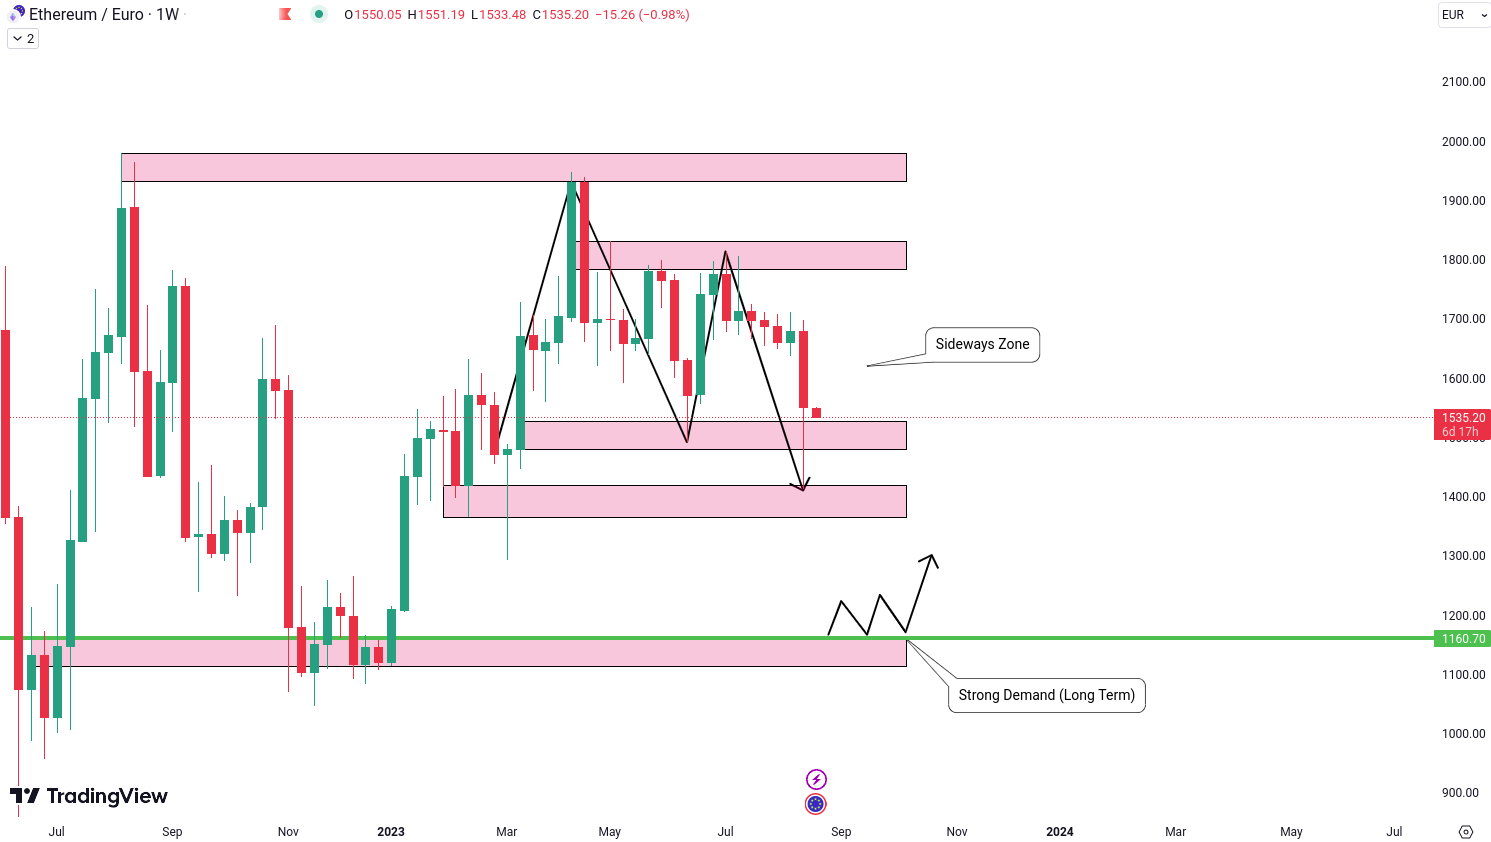
ETH/EUR has successfully attained the targets we previously emphasized. Nevertheless, the situation on the weekly chart is becoming somewhat unclear due to the presence of multiple demand regions in close proximity to the current price. This accumulation of demand zones is generating a degree of uncertainty and could potentially result in lateral movement in the near term.
Taking the Long-Term View: Key Takeaway
During moments like these, it becomes crucial to zoom out and contemplate the broader perspective. Adopting a long-term outlook for ETH/EUR could prove to be a prudent decision. An area that carries substantial promise is the 1,160 Euro zone, a resilient demand region. This level can be viewed as a stronghold for traders with a long-term orientation.
Examining Sideways Movement Closely
The prospect of a sideways phase must not be dismissed, given the intricacy of the chart. Sideways markets can pose challenges in terms of navigation, often necessitating patience and vigilant observation. As the market finds equilibrium between supply and demand.

MultiversX (EGLD) analysis and update
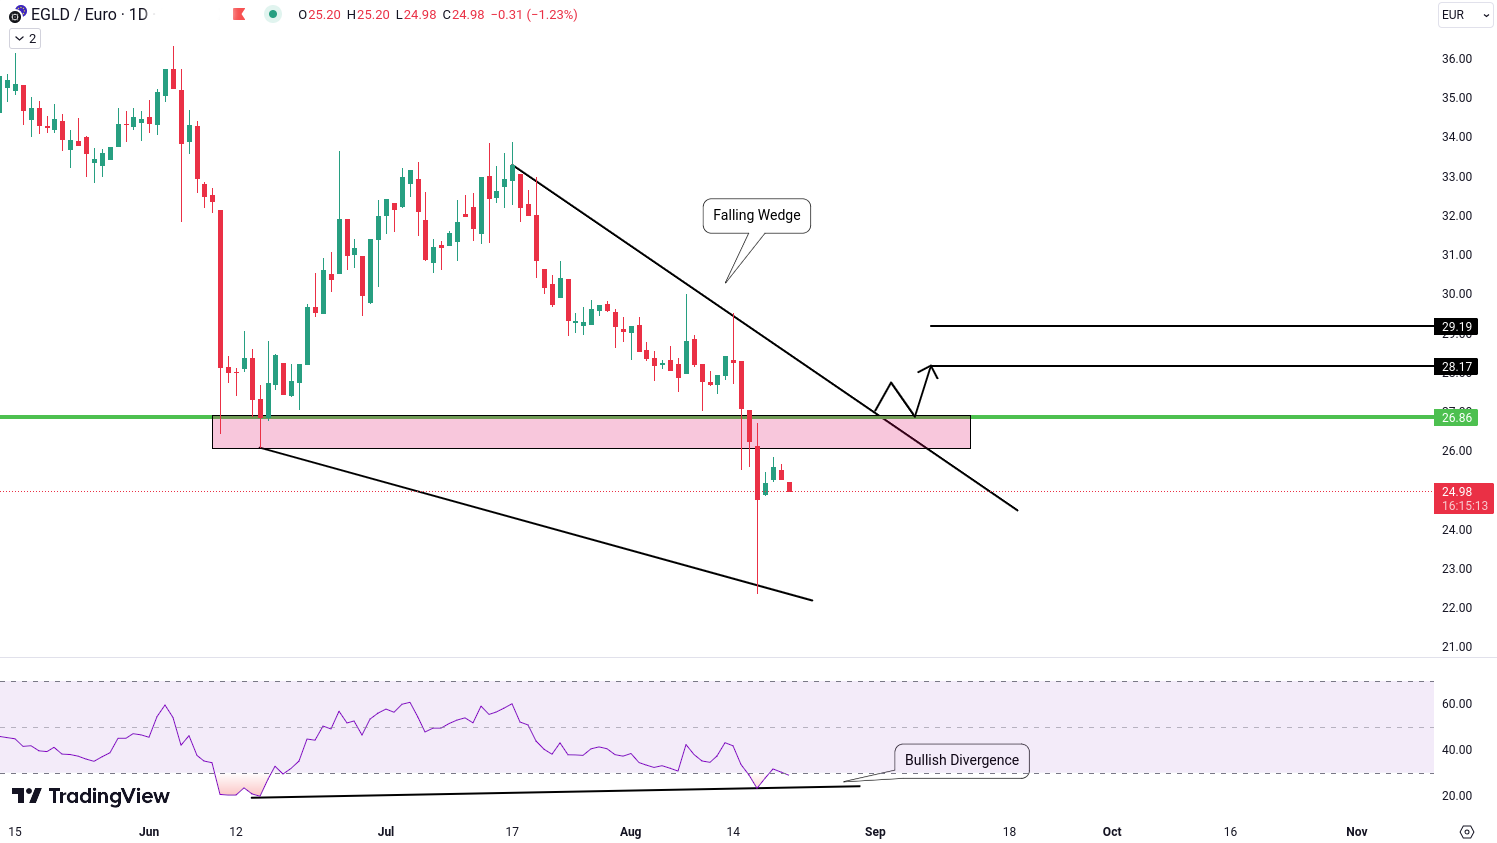
As observed on the daily chart of EGLD/EUR, the currency pair is currently in the process of forming a falling wedge pattern. This particular pattern often serves as an indicator for a potential bullish reversal, rendering it an attractive prospect for traders seeking fresh opportunities.
Pattern and Indicator
The falling wedge pattern in EGLD/EUR's chart, coupled with the presence of RSI bullish divergence, offers an intriguing landscape that warrants thorough consideration. The combination of this pattern and the RSI indicator amplifies the potential for a bullish narrative.
Critical Breakout Points
As we navigate through this chart, it becomes pivotal to identify breakout levels that could shape our trading strategy. Paying close attention to two pivotal points is essential: the upper trendline of the falling wedge and the resistance level at 26.86. If EGLD/EUR successfully breaches these levels, it could trigger a bullish sentiment, thereby opening up the possibility for potential gains.
Potential Upside Targets
Following a successful breakout, it becomes imperative to project potential upside targets. Traders can keep a vigilant eye on targets situated at 28.17 Euro and 29.19 Euro as prospective zones of interest.

Ripple (XRp) analysis and update
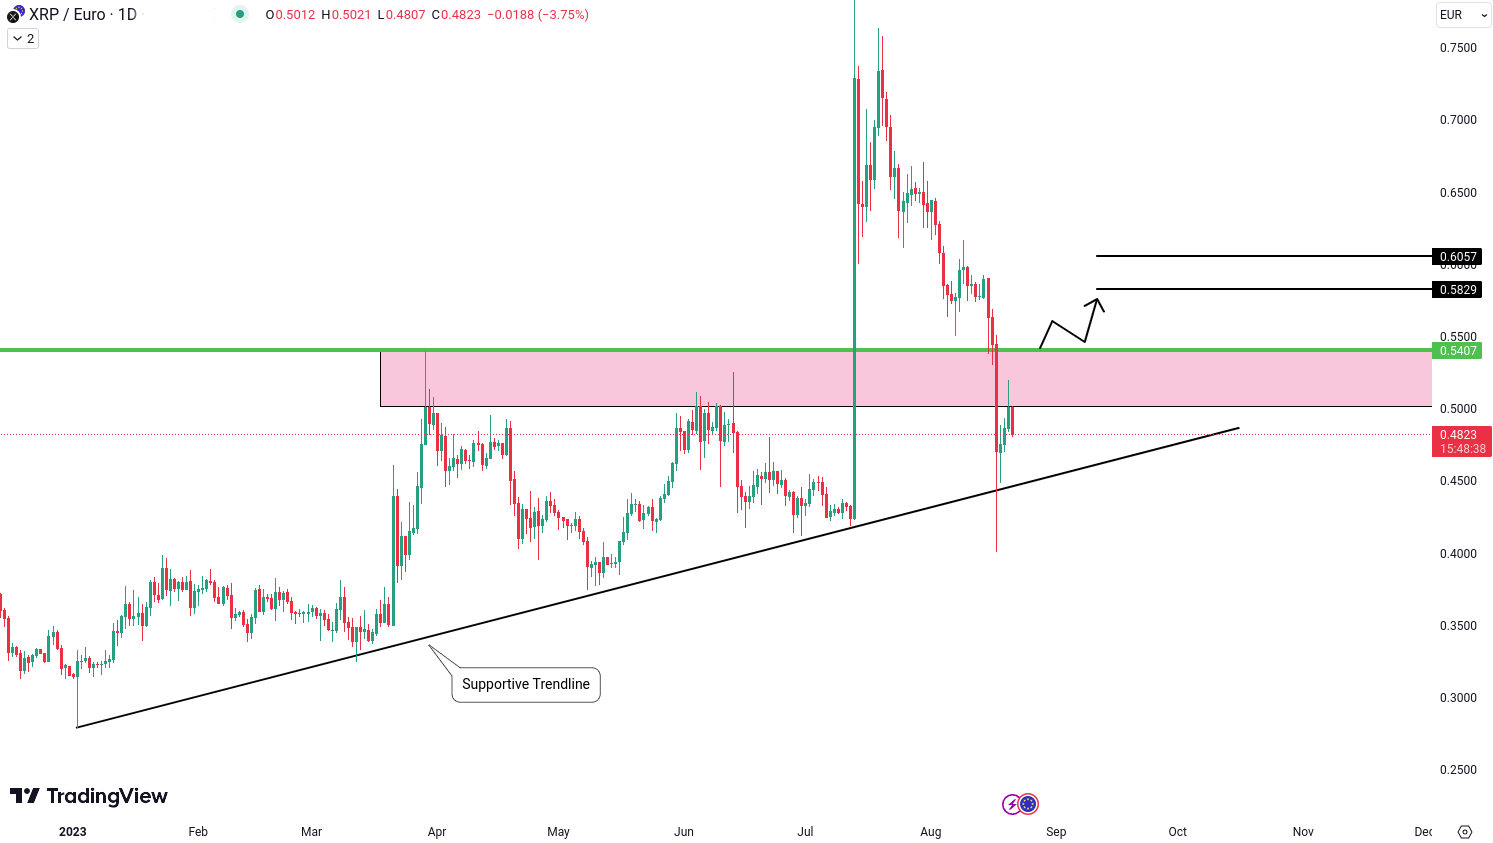
RP/EUR - The current situation indicates a shift in the price action. The currency pair is presently undergoing consolidation near a supportive trendline, suggesting a temporary halt in the downward momentum.
Resistance and Breakout Potential
Understanding this consolidation hinges on identifying the crucial junctures that might instigate fresh market dynamics. Our attention is drawn to the resistance level positioned around 0.5407 Euro. Should XRP/EUR succeed in surpassing this threshold, it has the potential to exhibit bullish movement.
Resistance Turning Into Support
A successful breach of the resistance level transitions it into a support zone, which could furnish the requisite impetus for a bullish upswing. This type of price behavior constitutes a fundamental tenet within technical analysis.
Exploration of Attainable Targets
If the breakout materializes and the former resistance morphs into a support, our plausible targets might hover around 0.5829 Euro and 0.6057 Euro.

All the analyzed cryptocurrencies are available for trading on the Tradesilvania platform, and their prices can be tracked on the Tradesilvania price page, accessible through the following link: https://tradesilvania.com/en/prices
With the help of the platform, you can deposit, withdraw, buy, or sell any of these cryptocurrencies using the free digital wallet.
Discover direct trading with fast SEPA on-ramp capabilities, over 80 cryptocurrencies available for SPOT trading and over 2000 tokens available trough our OTC Desk.
Limitation of Liability
This report issued by Tradesilvania is purely informative and is not intended to be used as a tool for making investment decisions in crypto-assets. Any person who chooses to use this report in the process of making investment decisions assumes all related risks. Tradesilvania SRL has no legal or other obligation towards the person in question that would derive from the publication of this report publicly.
The content provided on the Tradesilvania website is for informational purposes only and should not be considered as investment advice, financial advice, trading advice, or any other form of advice. We do not endorse or recommend the buying, selling, or holding of any cryptocurrency. It is important that you conduct your own research and consult with a financial advisor before making any investment decisions. We cannot be held responsible for any investment choices made based on the information presented on our website.
The information in this report was obtained from public sources and is considered relevant and reliable within the limits of publicly available data. However, the value of the digital assets referred to in this report fluctuates over time, and past performance does not indicate future growth.
Total or partial reproduction of this report is permitted only by mentioning the source.