Crypto Market update - 24 august 2023

Last 24h in crypto:
📊 Global crypto market cap: €974.46B ⬇️ 0.53% in the last day.
📈 Total crypto market volume in the last 24 hours: €26.27B ⬇️ 12.15%.
🏦 DeFi volume: €1.82B (6.93% of total).
💱 Stablecoin volume: €24.84B (94.57% of total).
💰 Bitcoin dominance: 48.29% ⬇️ 0.06%.
Bitcoin (BTC)
Analyzing the Hourly Chart
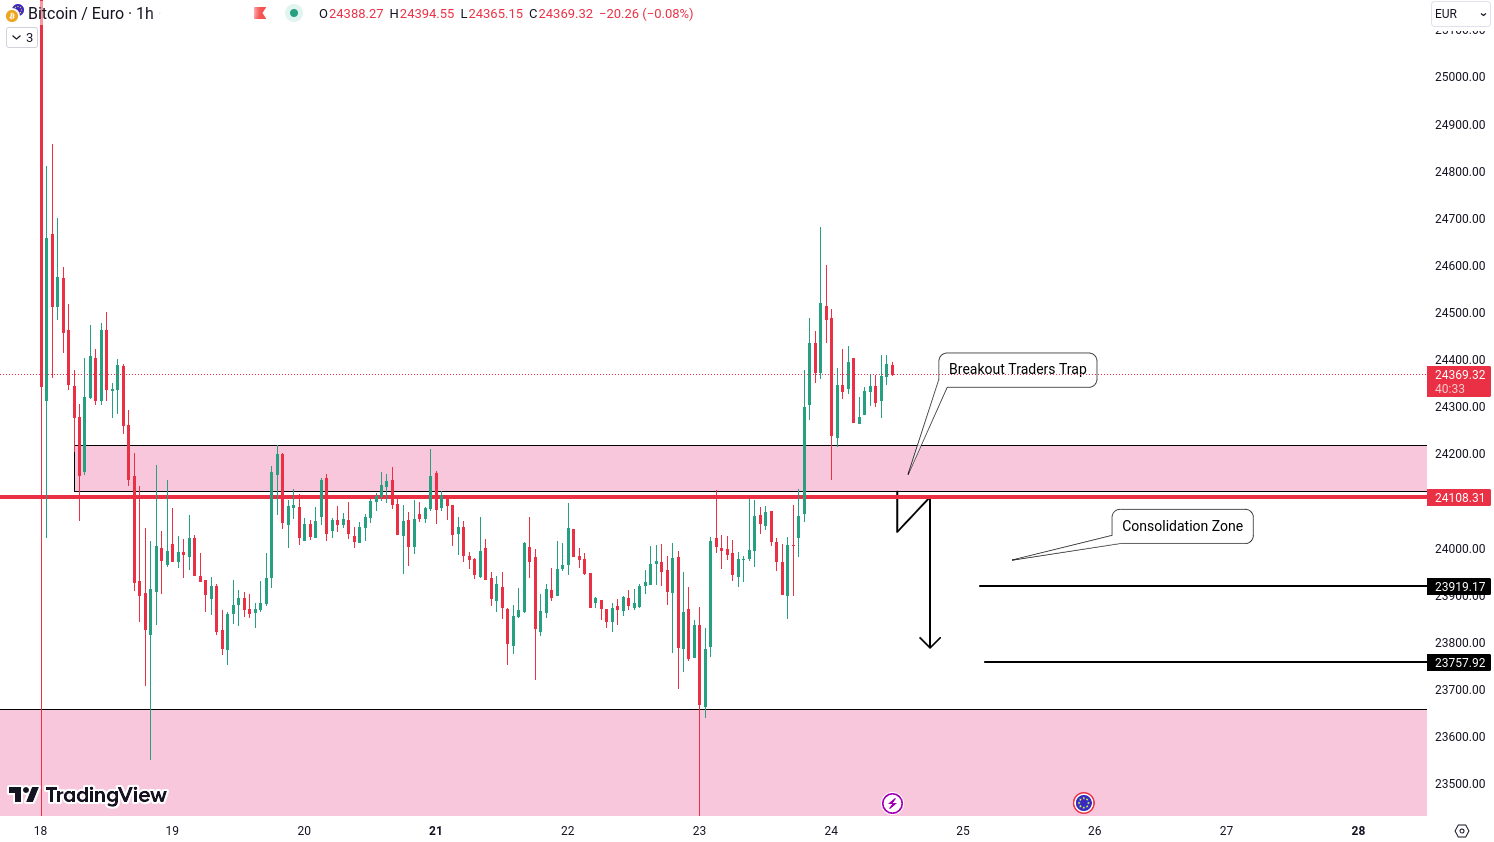
BTC/EUR has been adhering to our predictions of sideways movement, maintaining a balanced pace. Nevertheless, the hourly chart now offers an interesting twist. The price has experienced a breakout from a compact sideways zone, catching the eye of traders. But let's not be too hasty – trading isn't always straightforward.
Beware the False Breakout
The breakout might lead some to believe that a bullish trend is imminent. However, seasoned traders understand that things aren't always what they seem in the trading world.
The Trap: A Closer Look
Here's the twist: If BTC/EUR retraces and dips back into the recently broken zone, it could set a trap for those who hastily jumped in during the breakout. This scenario serves as a reminder not to yield to impulsive trading decisions.
Exploring Potential Targets
If the price does retreat below the 24,108 Euro level, it's plausible that the stop-loss orders of traders who entered the market on the breakout could be triggered. This chain of events might subsequently steer the price downward, leading to potential targets around 23,919 Euro and 23,757 Euro.
Ethereum (ETH)
ETH/EUR is showing signs of an inverse head and shoulders pattern. This pattern has three parts – two lower points that look like shoulders, and a higher one in the middle that's the "head." It's an interesting pattern that traders pay attention to.
While the probability of a breakout beyond the neckline and resistance level is relatively low, if the price manages to go above the neckline and level of 1567.97 Euro. In this case, we could expect the price to reach around 1625.04 Euro and 1644.59 Euro.
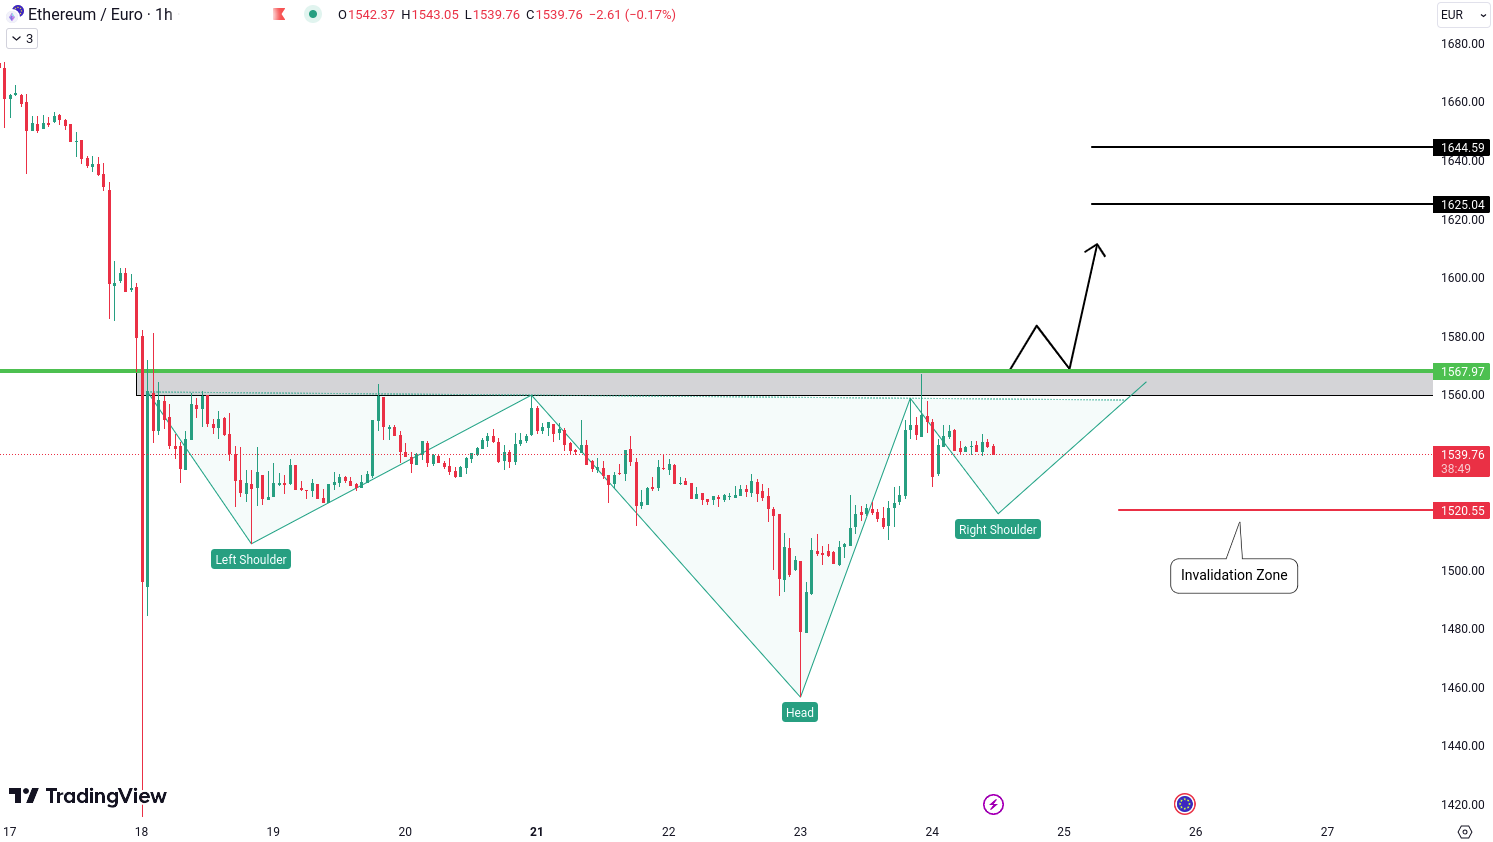
Let's not ignore the other possibility. If things go in a negative direction and the price goes below the level of 1520.55 Euro, it changes the story. The pattern might not mean what we thought, and its effects would be uncertain.
MultiversX (EGLD)
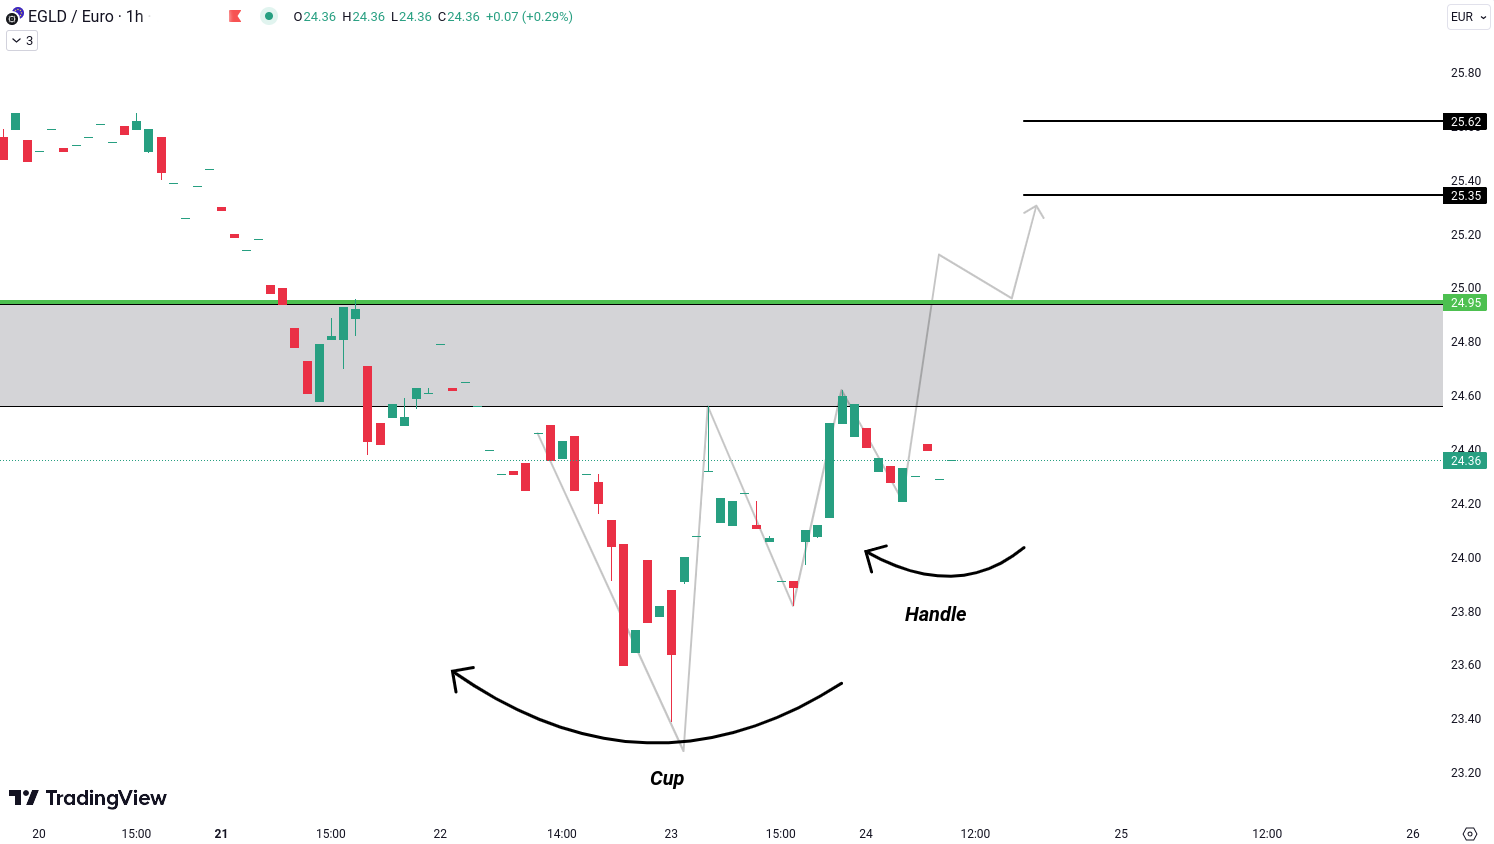
EGLD/EUR is currently showing us a classic cup and handle pattern on the hourly chart, which is known for its possible bullish outcomes. This pattern looks like a teacup with a handle – that's why it's called that way.
If the price manages to go above the level of 24.95, it could mean good things are coming. This breakthrough could lead to the price going up even more, aiming for the next levels of resistance – 25.35 and 25.62.
Focusing on the Handle
While the cup shape of the pattern gets a lot of attention, let's not forget about the handle. The handle usually happens after the cup and is like a small pattern within the bigger cup. It's like a pause before maybe seeing the price go up again.
AAVE
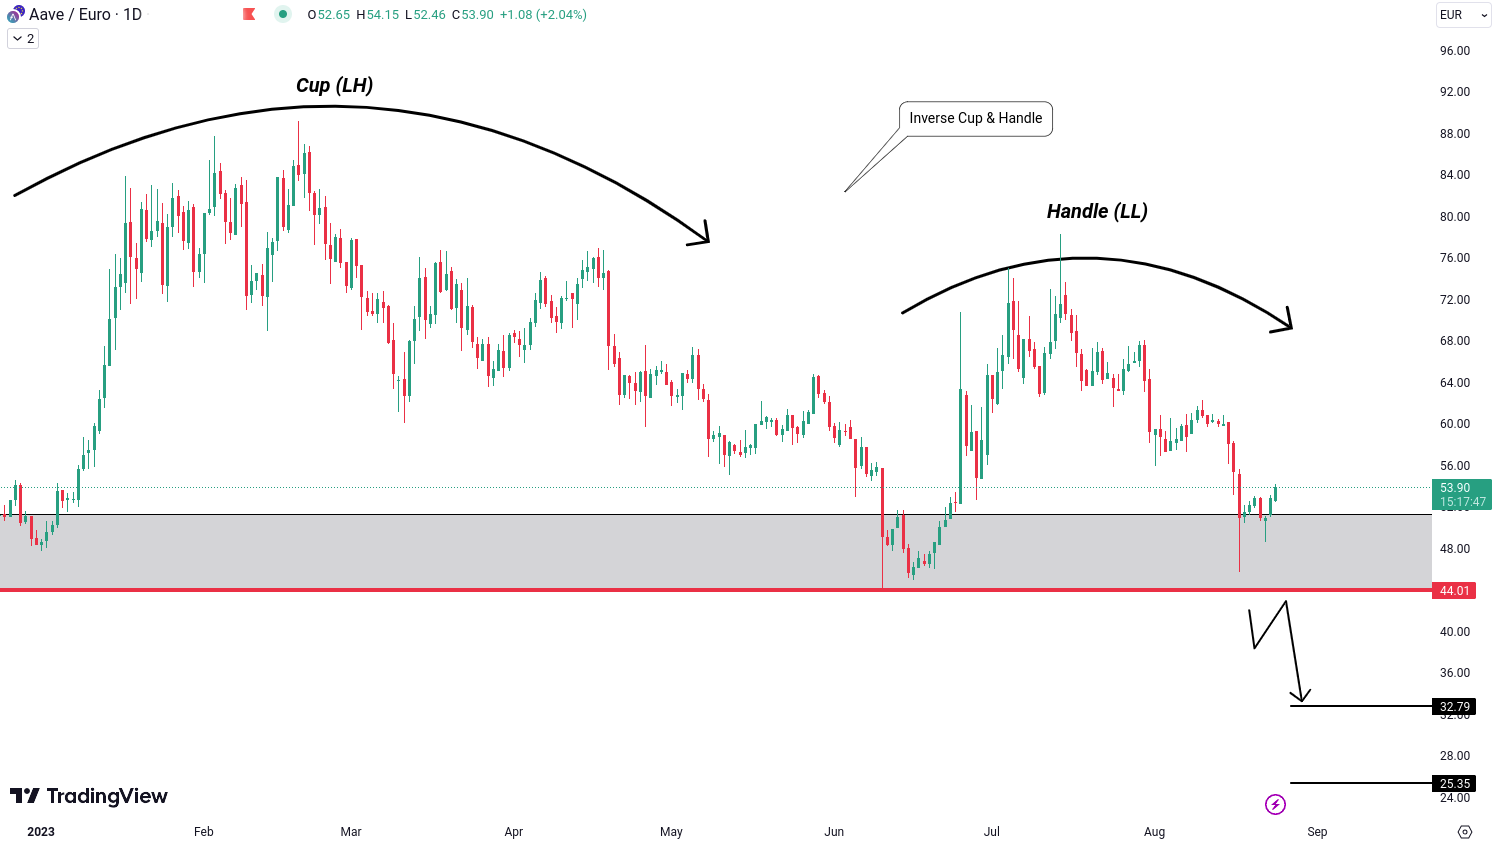
AAVE/EUR forming an interesting pattern that we should take a closer look at – the inverse cup and handle on the daily chart. Unlike the regular cup and handle, this pattern suggests a potential downward movement, indicating a possible bearish trend ahead.
Understanding the Pattern
The inverse cup and handle pattern is made up of lower highs and lower lows. This indicates that the price momentum is gradually declining. It's a strong sign that there might be a bearish trend coming up.
The Breakdown Possibility
If AAVE/EUR goes below the critical support level at 44.01, it could trigger a series of bearish movements. This breakdown might lead to the price going down further, potentially reaching the next support levels at 32.79 Euro and 25.35 Euro.
BNB
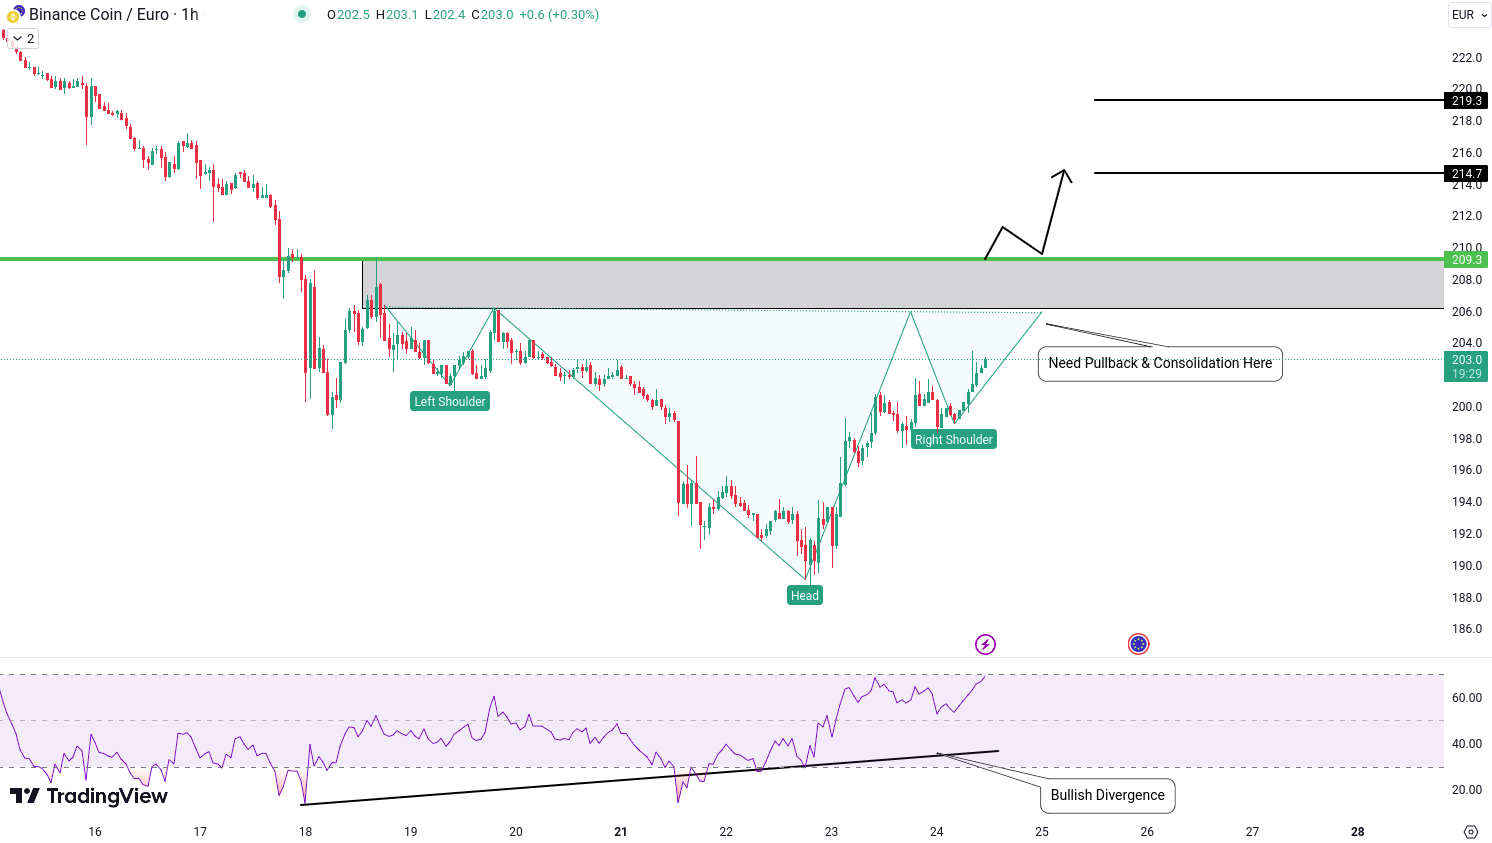
The inverse head and shoulder pattern is an interesting formation that suggests a possible change in trend direction, and we're seeing it on the hourly chart of BNB/EUR.
Understanding the Pattern
This pattern consists of three main parts: two lower points (the shoulders) and a deeper low point in the middle (the head). When the price starts to go up after the second low point and forms a line connecting these lows (the neckline), it can be a sign that the trend might reverse.
The Role of RSI Divergence
We also observe a bullish divergence in the Relative Strength Index (RSI). This divergence points out a difference between the price movement and the RSI indicator. This could indicate the possibility of the price gaining upward momentum.
The Potential Breakout
If BNB/EUR manages to go above the neckline and the resistance level at 209.3, it could open the door for a bullish trend. This breakout could lead to the price moving towards the next levels of resistance at 214.7 and 219.3, possibly showing a shift in how the market is behaving.
The Need for Patience
Before the potential breakout, We need a small pullback or a period of consolidation below the breakout level. This pullback contributes to forming a proper right shoulder in the pattern and helps traders identify clear entry points and potential directions.
All the analyzed cryptocurrencies are available for trading on the Tradesilvania platform, and their prices can be tracked on the Tradesilvania price page, accessible through the following link: https://tradesilvania.com/en/prices
With the help of the platform, you can deposit, withdraw, buy, or sell any of these cryptocurrencies using the free digital wallet.
Discover direct trading with fast SEPA on-ramp capabilities, over 80 cryptocurrencies available for SPOT trading and over 2000 tokens available trough our OTC Desk.
Limitation of Liability
This report issued by Tradesilvania is purely informative and is not intended to be used as a tool for making investment decisions in crypto-assets. Any person who chooses to use this report in the process of making investment decisions assumes all related risks. Tradesilvania SRL has no legal or other obligation towards the person in question that would derive from the publication of this report publicly.
The content provided on the Tradesilvania website is for informational purposes only and should not be considered as investment advice, financial advice, trading advice, or any other form of advice. We do not endorse or recommend the buying, selling, or holding of any cryptocurrency. It is important that you conduct your own research and consult with a financial advisor before making any investment decisions. We cannot be held responsible for any investment choices made based on the information presented on our website.
The information in this report was obtained from public sources and is considered relevant and reliable within the limits of publicly available data. However, the value of the digital assets referred to in this report fluctuates over time, and past performance does not indicate future growth.
Total or partial reproduction of this report is permitted only by mentioning the source.