Crypto Market update 3 July 2023

💰 The total crypto market cap is €1.11 trillion, with a 1.03% increase in the last day.
💼 The total volume of the crypto market in the past 24 hours is €30.36 billion, showing a 31.87% increase.
📊 DeFi represents 8.33% of the total market volume in the past 24 hours, with a volume of €2.53 billion.
💱 Stablecoins account for 90.47% of the total 24-hour market volume.
📉 Bitcoin's dominance is currently at 49.23%, experiencing a 0.32% decrease during the day.
Bitcoin (BTC)
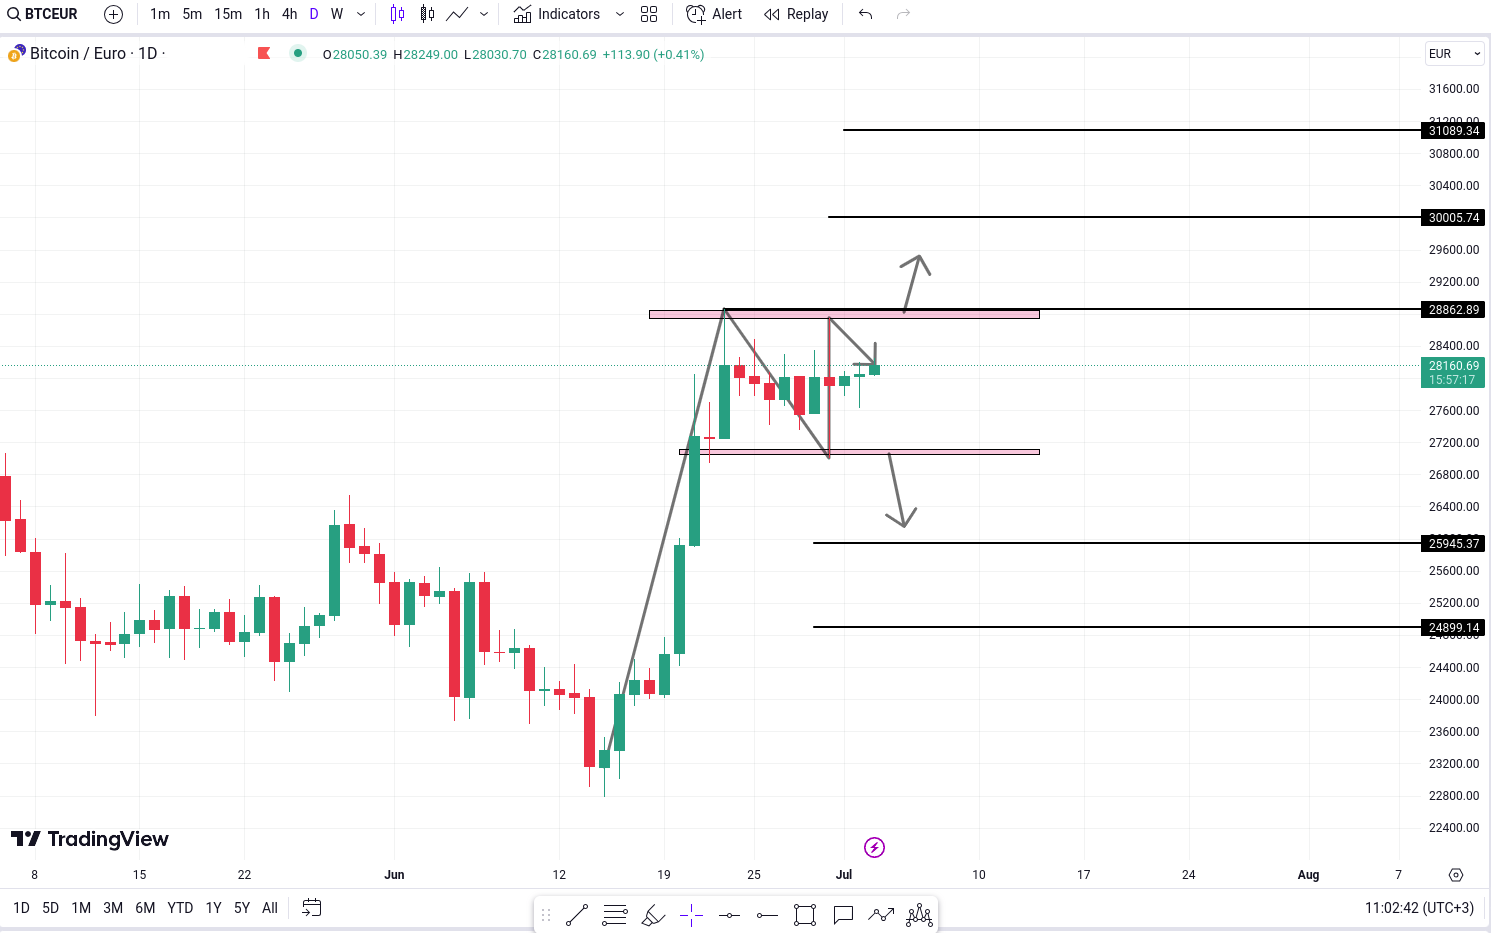
Technical analysis plays a vital role in cryptocurrency trading, and one widely recognized pattern in the Bitcoin/Euro (BTC/EUR) pair is the flag and pole pattern. However, the current state of prolonged consolidation, indicates a higher likelihood of a bearish outcome. In this analysis, we will explore the flag and pole pattern in BTC/EUR and analyze potential price targets in both bullish and bearish scenarios.
At present, the BTC/EUR pair is experiencing an extended consolidation phase, which raises concerns for traders. This prolonged period of trading within a defined range, accompanied by low volatility and trading volumes, reflects market indecision and a lack of clear market direction.
Considering the lengthy consolidation period, the probability of a bearish outcome becomes more pronounced. Extended consolidation often precedes significant price movements, and when combined with the flag and pole pattern, it suggests the potential for downward pressure on BTC/EUR.
If the BTC/EUR pair manages to break above the 28,862 Euro level, it could trigger a bullish scenario. In such a case, potential price targets would be set around 30,000 Euro and 31,000 Euro. However, caution should be exercised as the prolonged consolidation phase might hinder the upward momentum.
Conversely, if the BTC/EUR pair breaks below the 27,003 Euro level, it would indicate a bearish scenario. In such a situation, potential downside targets would be around 25,945 Euro and 24,899 Euro. Traders should closely monitor the price action and volume during such breakdowns to confirm the validity of the bearish trend.
It's essential for investors to stay vigilant and consider these technical aspects in their decision-making process to navigate the BTC/EUR market effectively.
Ethereum (ETH)
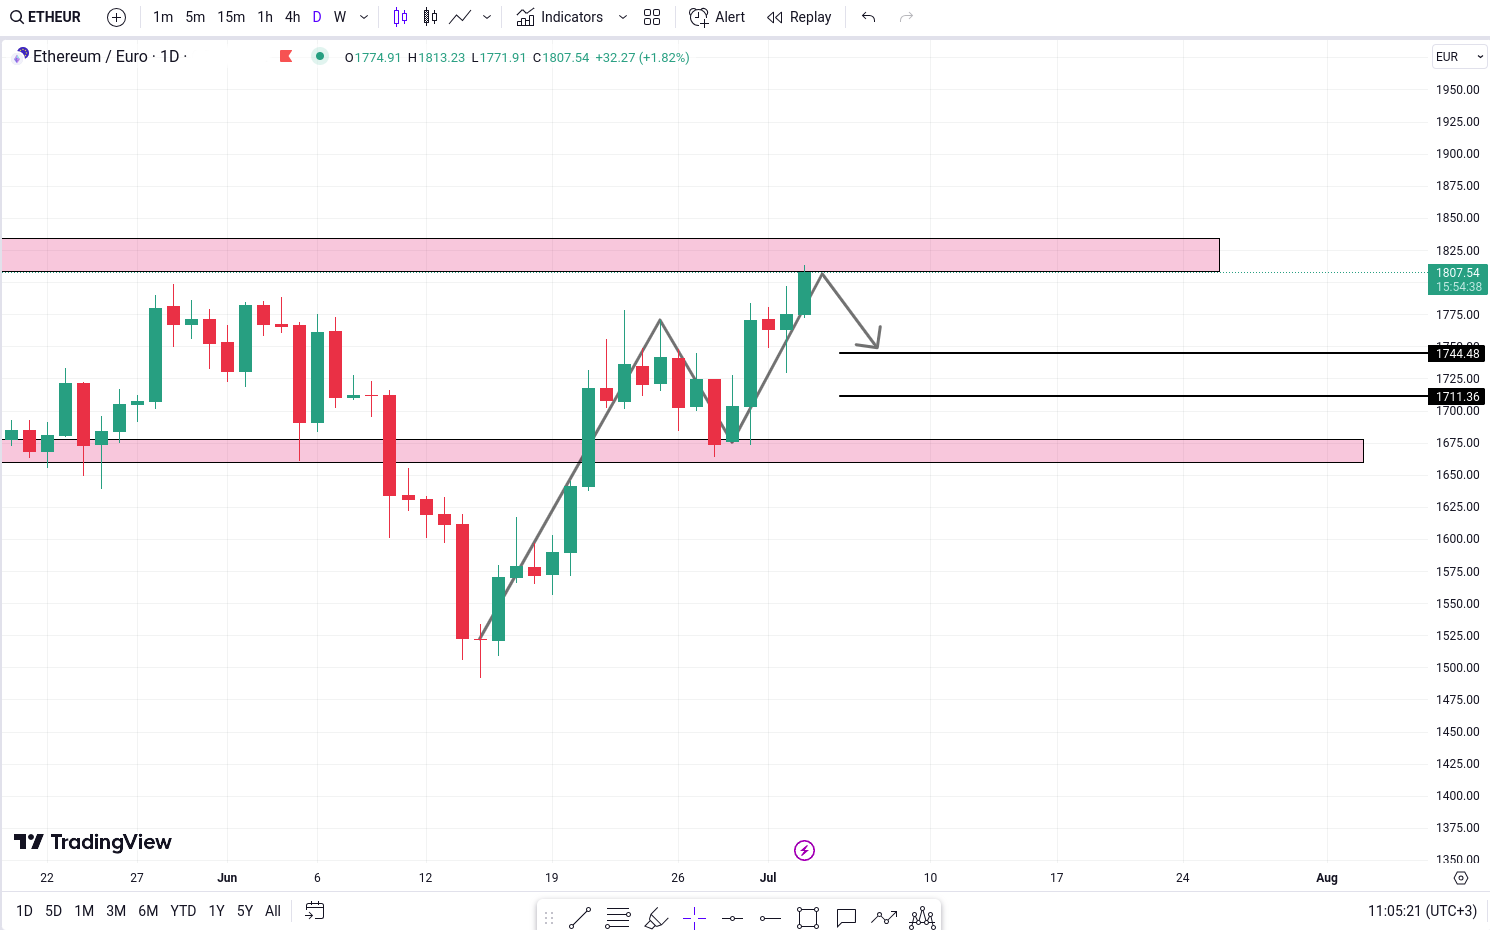
Ethereum is currently in close proximity to a significant supply zone, signaling the possibility of a near-term reversal. This zone represents a region where sellers are anticipated to surpass buyers, potentially causing a shift in market sentiment.
Given the proximity to the supply zone, the likelihood of a bearish reversal is elevated.
In the event of a bearish reversal occurring near the supply zone, there are potential downside targets at 1,744 Euro and 1,711 Euro. These levels are areas where additional selling pressure could emerge, resulting in a decline in Ethereum's value relative to the Euro.
MultiversX (EGLD)
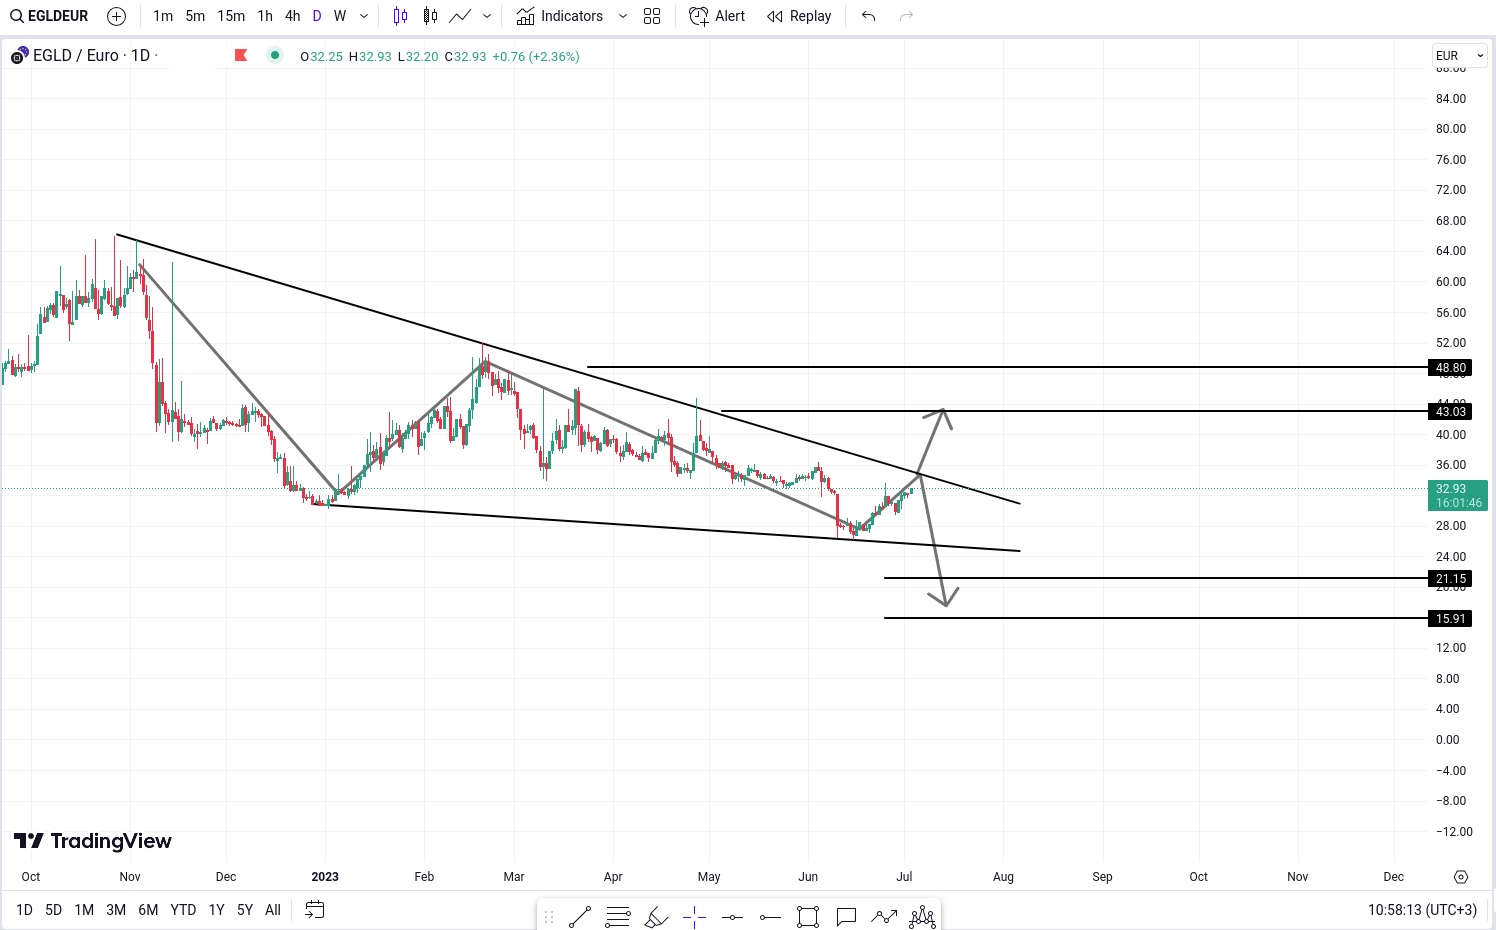
If MultiversX (EGLD) manages to surpass the bearish trendline within the falling wedge pattern, it has the potential to trigger a bullish breakout. In such a scenario, traders should keep an eye on price targets around 43 Euro and 48 Euro. These levels signify zones where buying pressure could escalate, leading to further upward movement.
On the flip side, if EGLD/EUR fails to breach the bearish trendline and instead breaks below the lower trendline of the falling wedge pattern, it may indicate a continuation of the bearish trend. In such a situation, potential downside targets might be approximately 21 Euro and 15 Euro. These levels represent areas where selling pressure may intensify, potentially pushing the price lower.
Polygon (MATIC)
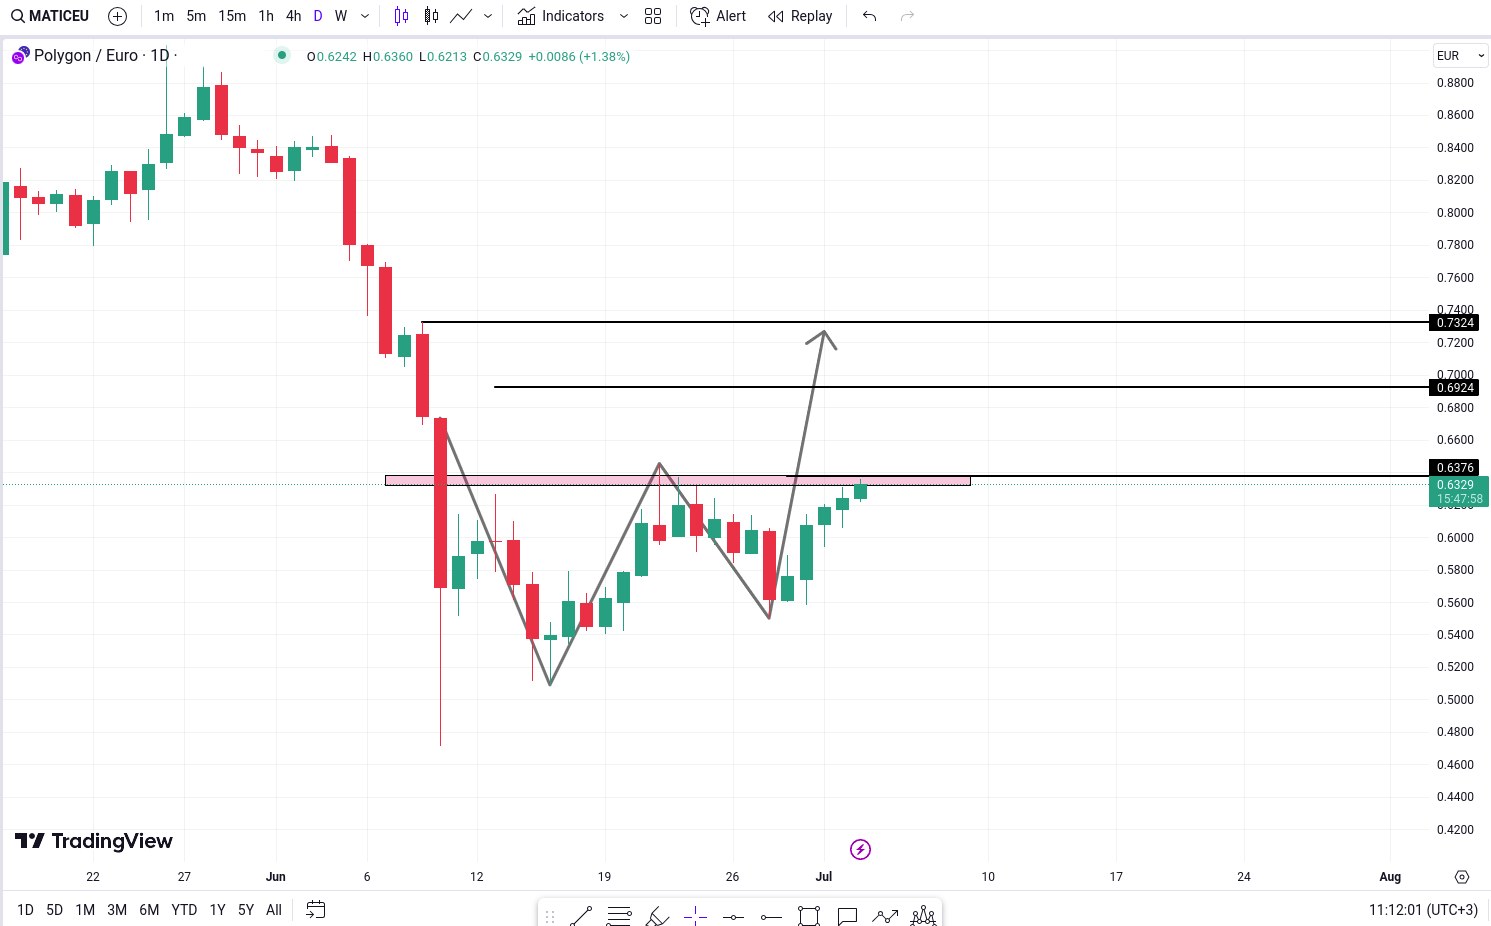
The MATIC/EUR pair is currently exhibiting the formation of a W pattern, which indicates a potential reversal in the trend from bearish to bullish. This pattern suggests that buyers are gaining momentum and may soon drive the price higher.
If Polygon (MATIC) manages to break above the significant level of 0.6376 Euro, it could initiate a bullish breakout, confirming the formation of the W pattern. This breakout would signal a change in market sentiment and potentially propel the price upwards. Traders should closely monitor potential targets around 0.6924 Euro and 0.7324 Euro.
PEPE (PEPE)
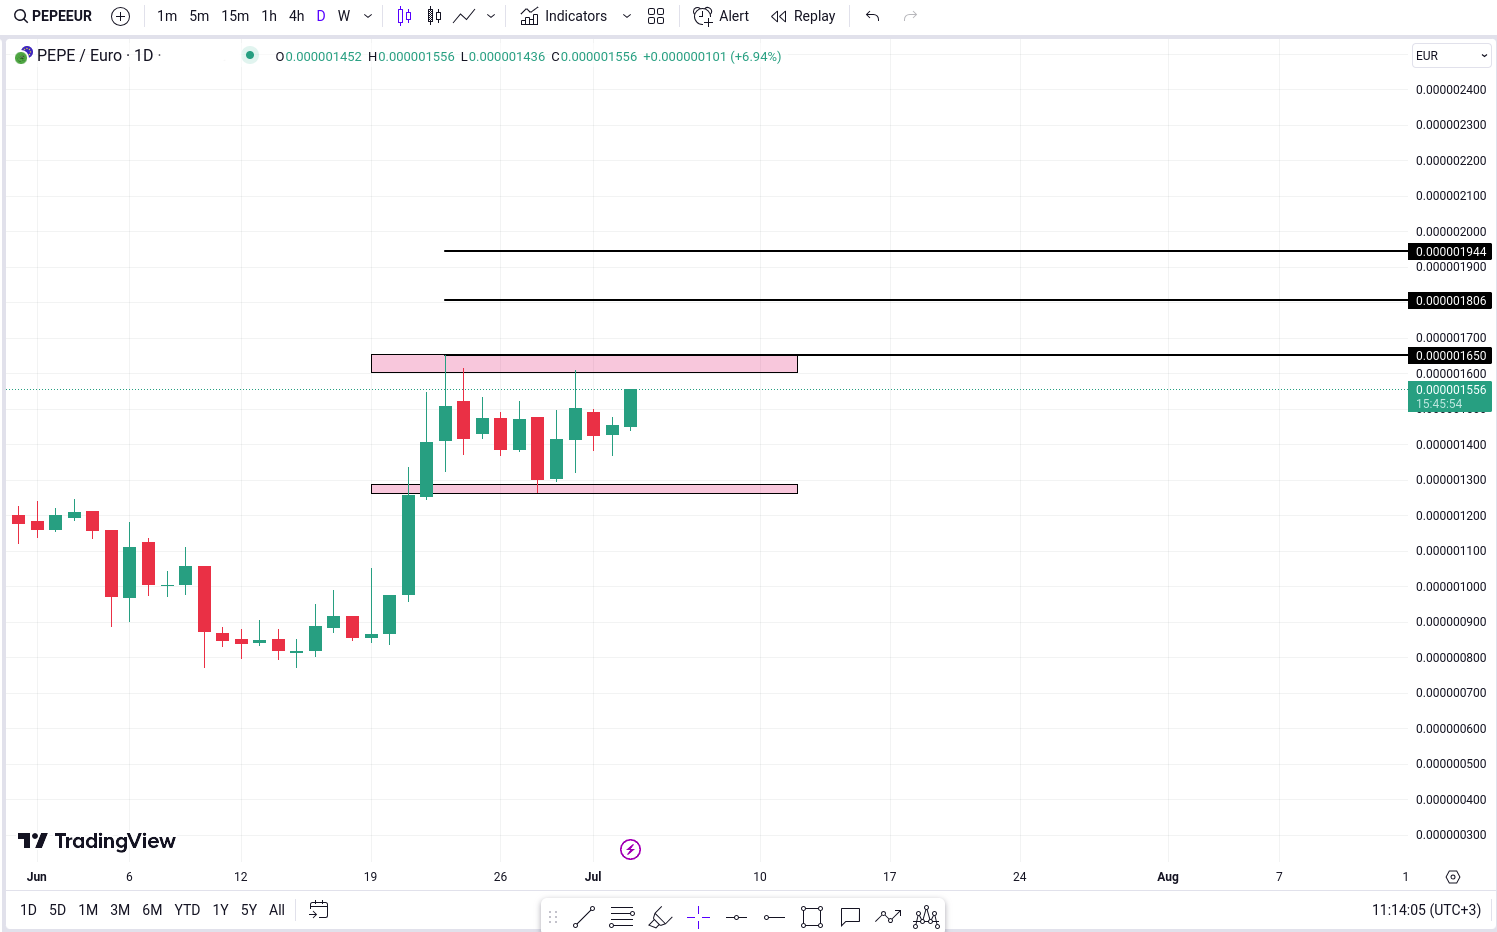
PEPE is currently exhibiting the formation of a flag and pole pattern, which suggests a potential continuation of the previous upward trend. This pattern is characterized by a consolidation phase following a significant price movement, and a breakout above the upper trend line of the flag could indicate a resumption of the upward momentum.
If the PEPE/Euro pair successfully breaks above the key level of 0.000001650, it could trigger a bullish breakout, confirming the formation of the flag and pole pattern. This breakout would serve as validation for the expected continuation of the upward trend. Traders should consider potential targets in the vicinity of 0.000001806 Euro and 0.000001944 Euro.
SUI (SUI)
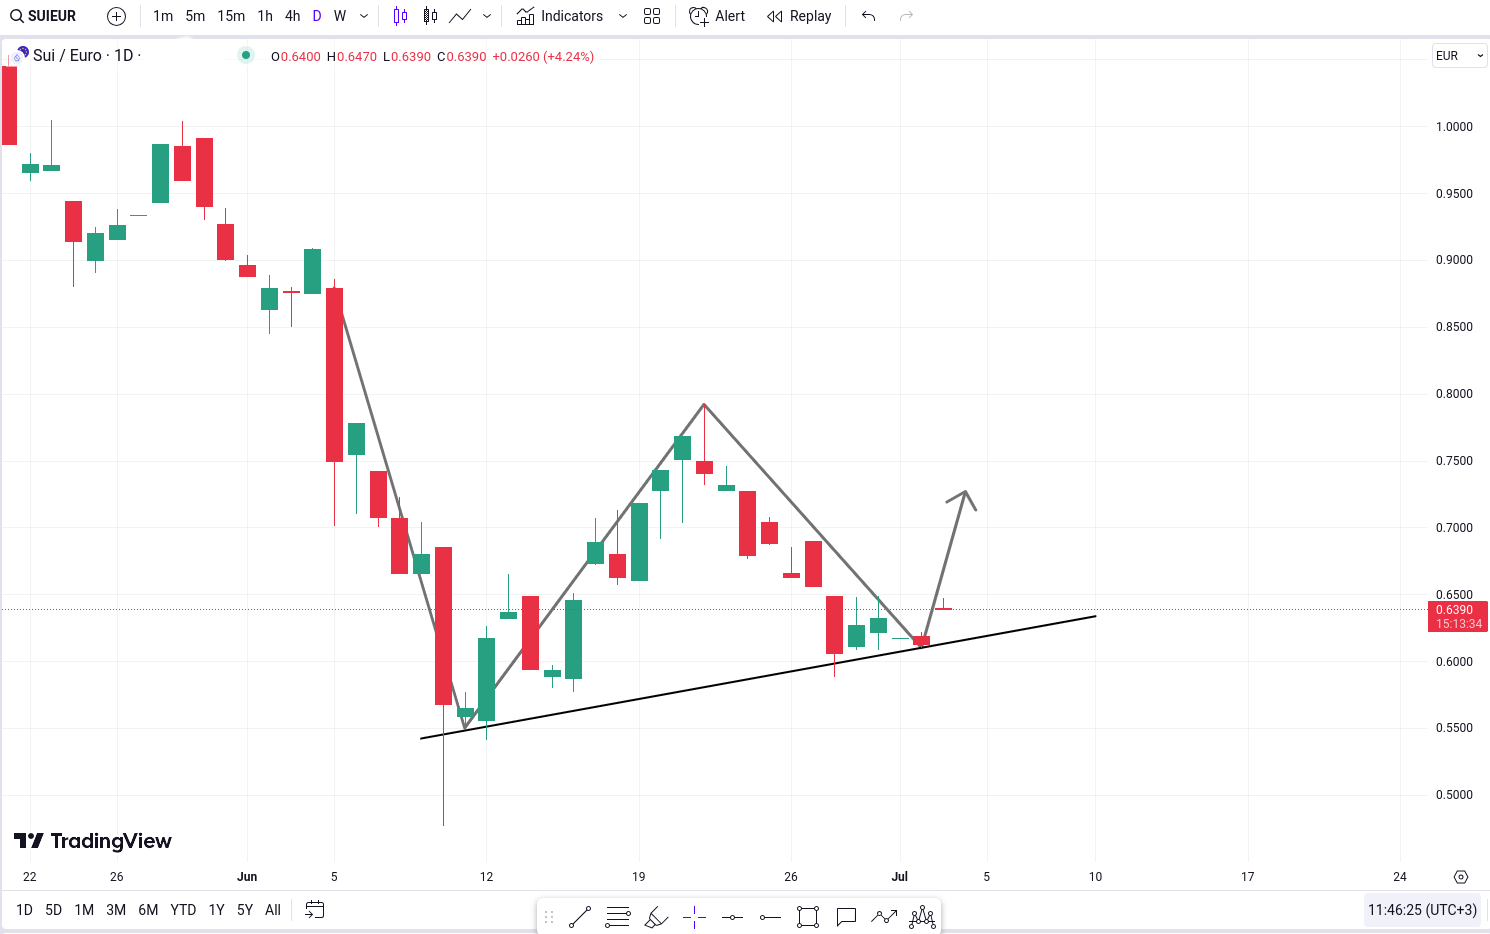
SUI is currently near to a significant trendline, suggesting the possibility of finding support at this level and potentially reversing its direction.
Dogecoin (DOGE)
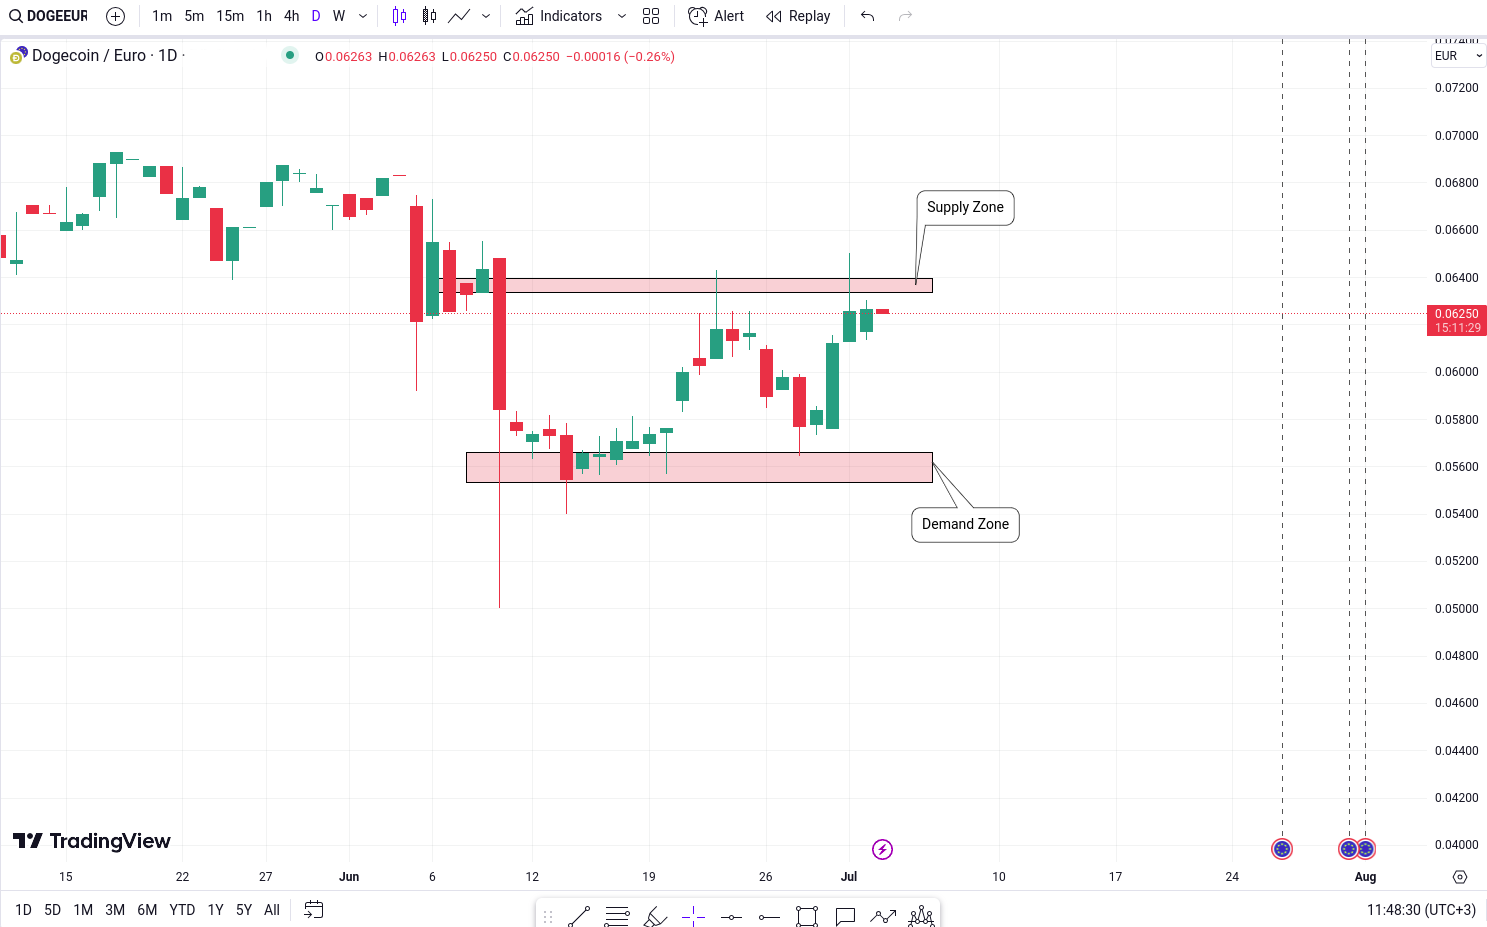
Dogecoin (DOGE) is currently approaching a significant supply zone, indicating the potential for a bearish reversal.
Limitation of Liability
This report issued by Tradesilvania is purely informative and is not intended to be used as a tool for making investment decisions in crypto-assets. Any person who chooses to use this report in the process of making investment decisions assumes all related risks. Tradesilvania SRL has no legal or other obligation towards the person in question that would derive from the publication of this report publicly.
The content provided on the Tradesilvania website is for informational purposes only and should not be considered as investment advice, financial advice, trading advice, or any other form of advice. We do not endorse or recommend the buying, selling, or holding of any cryptocurrency. It is important that you conduct your own research and consult with a financial advisor before making any investment decisions. We cannot be held responsible for any investment choices made based on the information presented on our website.
The information in this report was obtained from public sources and is considered relevant and reliable within the limits of publicly available data. However, the value of the digital assets referred to in this report fluctuates over time, and past performance does not indicate future growth.
Total or partial reproduction of this report is permitted only by mentioning the source.