
Crypto Market update and analysis for BTC, ETH, EGLD, ADA and LTC - April 4, 2024

Crypto Market in the last 24h:
💰 Global Market Cap: $2.48T (-0.78%)
📊 Total 24h Volume: $94.43B (-22.93%)
🏦 DeFi Volume: $12.24B (12.96% of total volume)
💲 Stablecoins Volume: $88.87B (94.11% of total volume)
⚡ Bitcoin Dominance: 52.08%
BTC (Bitcoin) Analysis
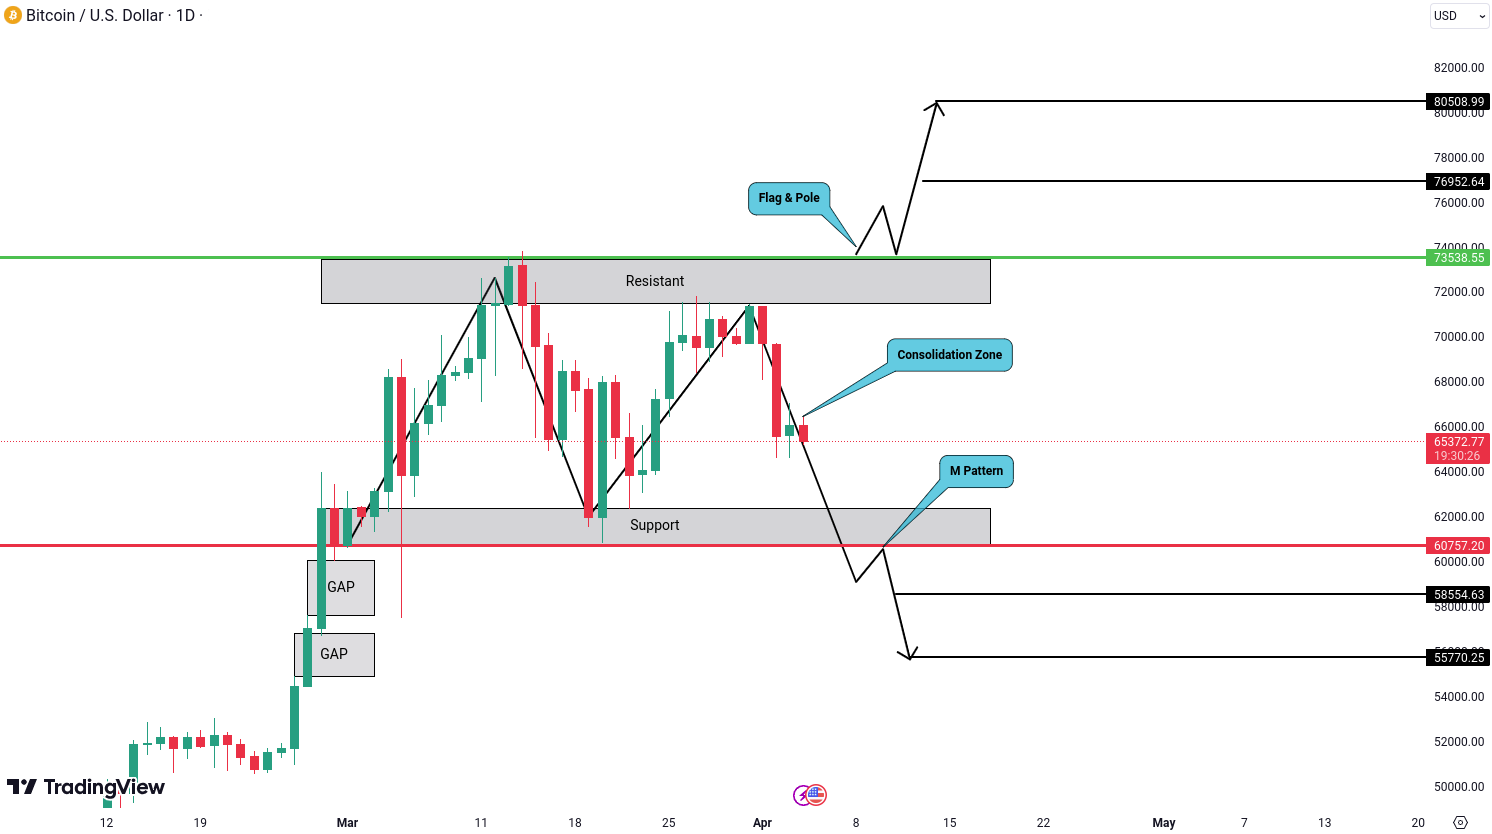
Currently, the price of BTC is hovering near a crucial support zone. If it breaks down from this level of 60757 USD, it could signal the formation of an M pattern, typically indicating a bearish trend ahead. In such a scenario, traders might set their sights on targets around 58554 USD and 55770 USD.
Conversely, if the price manages to break out above the resistance level of 73538 USD for the bullish scenario, it could pave the way for further upward movement because of the flag & pole pattern. In this case, traders might target levels around 76952 USD and 80508 USD.
ETH (Ethereum) Analysis
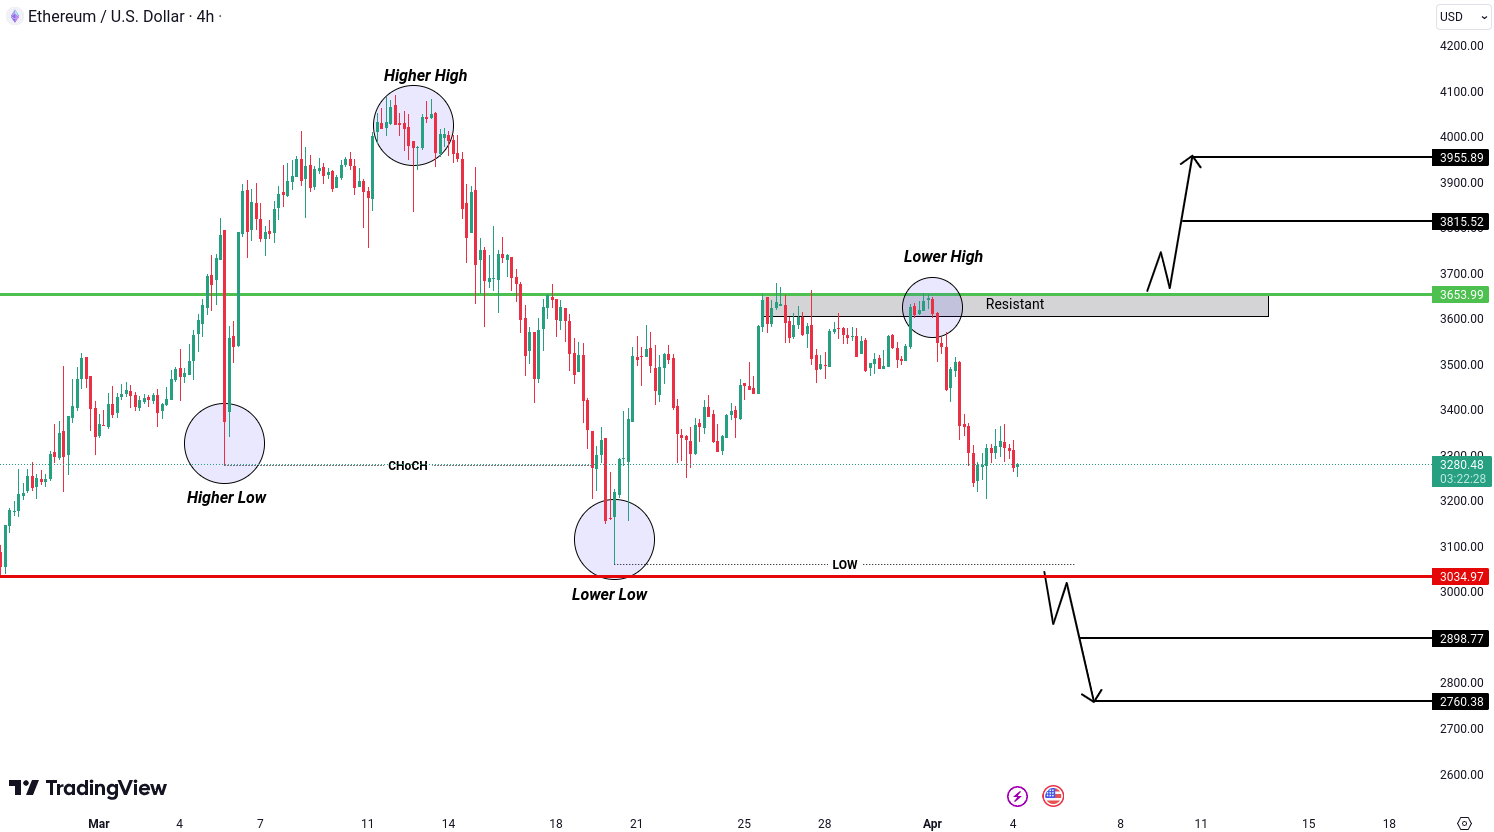
For ETH we’re noticing a shift from higher highs to lower lows, which suggests a potential bearish trend forming. If the price breaks below the level of the recent lower low, it could signal further downward movement, with potential targets around 2898 USD and 2760 USD.
Conversely, if the price manages to break out above the recent lower high level, currently around 3653 USD, it could indicate a bullish reversal. In such a scenario, traders might anticipate targets around 3815 USD and 3955 USD.
EGLD (MultiversX) Analysis
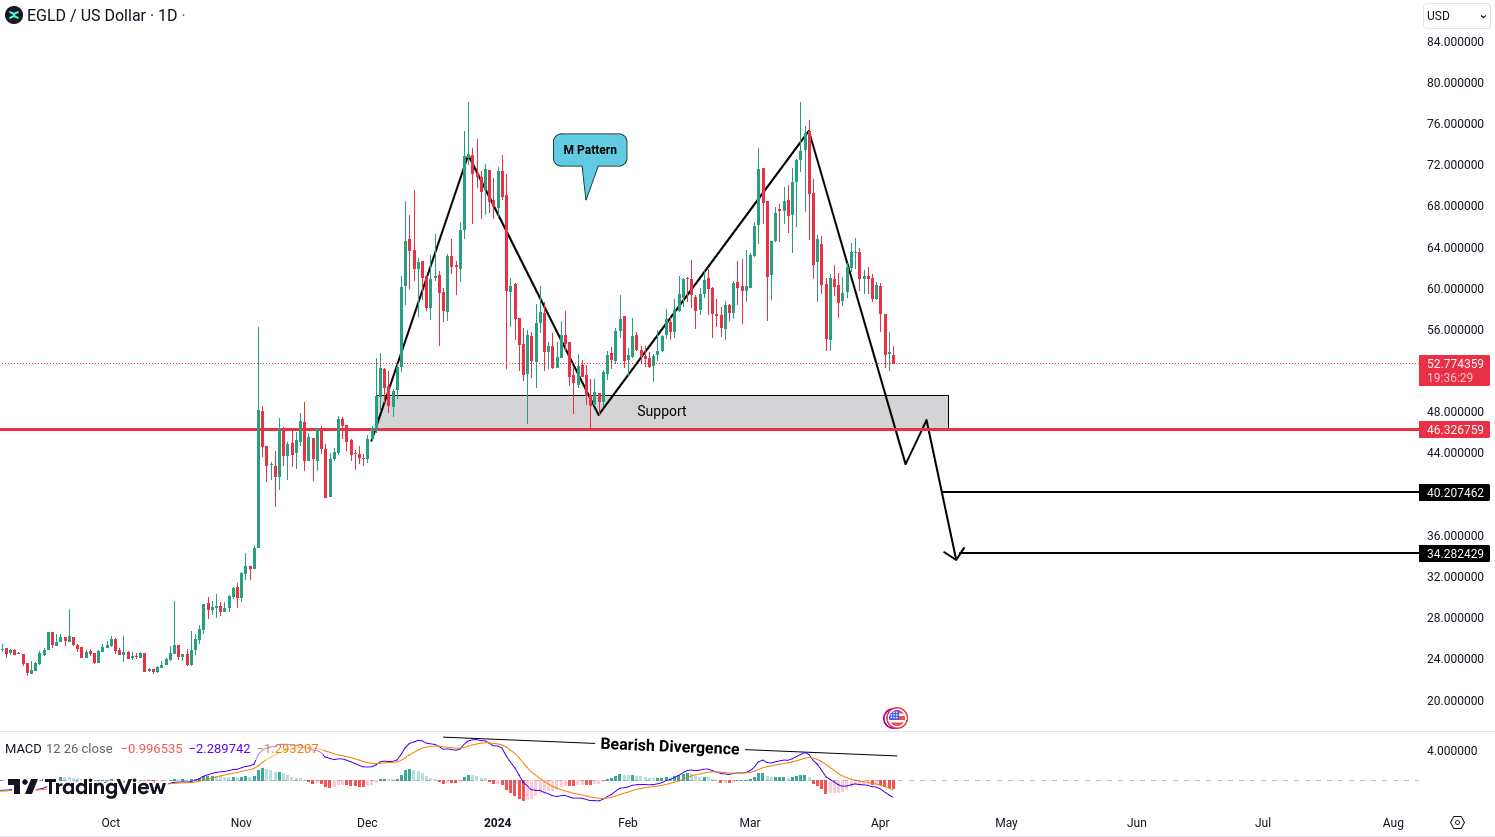
EGLD is forming an M pattern, accompanied by bearish divergence on the MACD indicator. This suggests a potential bearish trend developing. To confirm this pattern, we’ll be looking for a breakdown below the level of 46.32 USD. It could indicate further downward movement, with potential targets around 40.20 USD and 34.28 USD.
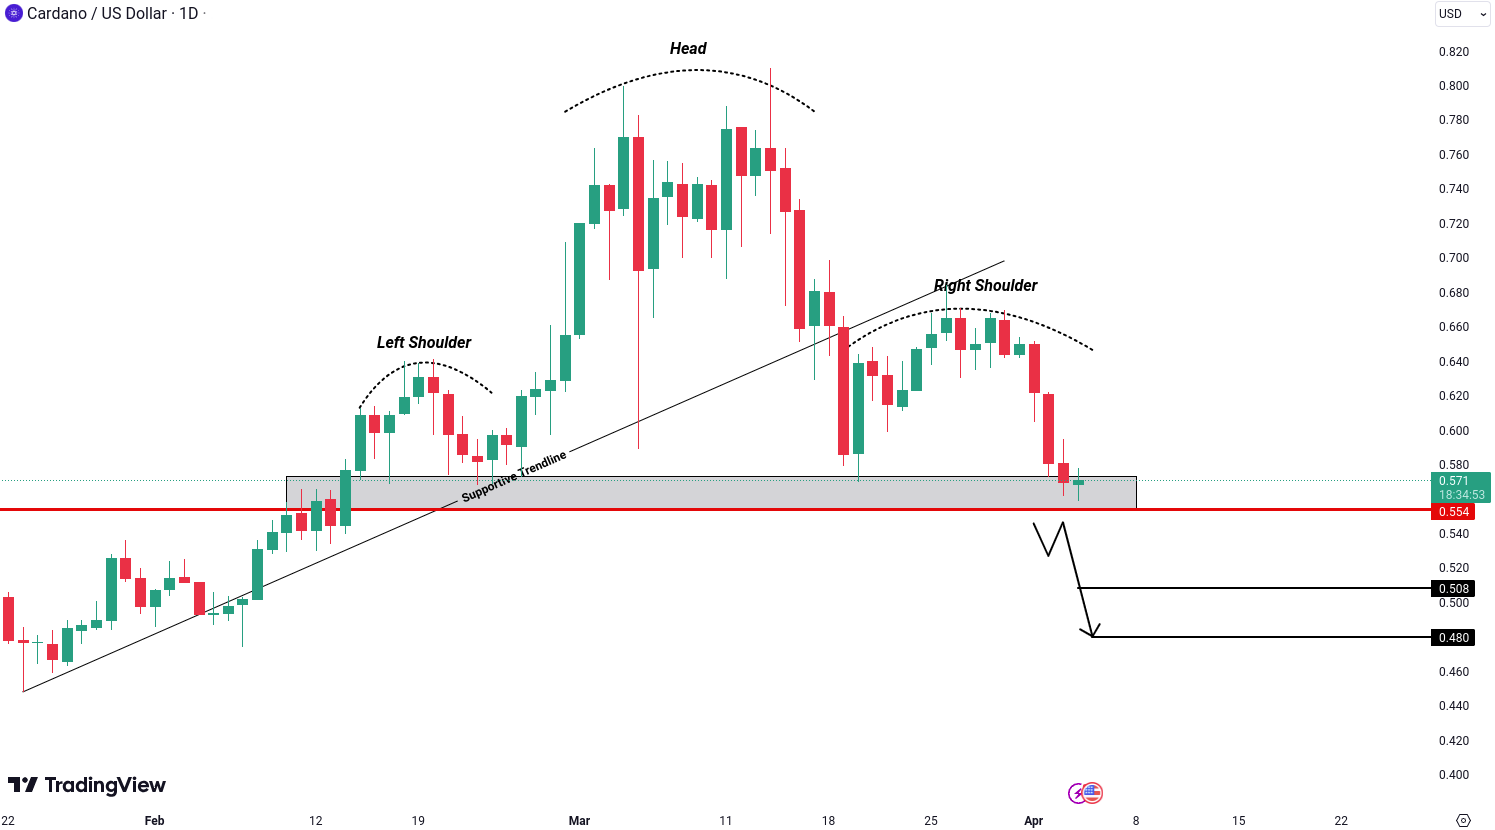
ADA (Cardano) Analysis
The price of ADA has broken below a supportive trendline and has formed a head and shoulders pattern. This pattern often indicates a potential bearish trend ahead. To confirm this pattern, we’ll be closely monitoring the price action for a breakdown below the key level of 0.554 USD.
If the price indeed breaks below this level, it could signal further downward movement, with potential targets around 0.508 USD and 0.480 USD.

LTC (Litecoin) Analysis
LTC shows the triple top formation. This occurs when the price reaches a resistance level three times without breaking above it, suggesting a significant barrier for further upward movement. Typically, this pattern is viewed as bearish by traders.
To confirm the validity of this pattern, we’ll be closely monitoring the price action for a breakdown below the key support level of 92.84 USD. If the price indeed falls below this level, it could signal a continuation of the bearish trend, with potential downside targets around 89.32 USD and 86.37 USD.
Do you agree with our analysis and interpretation of the market?
Want to learn more or have a different perspective?
Let's discuss it in the Tradesilvania community 👉 Telegram Group
All cryptocurrencies are available for trading on Tradesilvania , and their prices can be seen on the Tradesilvania price page, accessible through the following link: https://tradesilvania.com/en/prices
With the help of our platform, you can deposit, withdraw, buy, or sell any of these cryptocurrencies using the free digital wallet.
SEPA Top-up (On-Ramp & Off-Ramp) Euro and RON instant transfers and over 100 cryptocurrencies, are all available in our app.
Limitation of Liability
This report issued by Tradesilvania is purely informative and is not intended to be used as a tool for making investment decisions in crypto-assets. Any person who chooses to use this report in the process of making investment decisions assumes all related risks. Tradesilvania SRL has no legal or other obligation towards the person in question that would derive from the publication of this report publicly.
The content provided on the Tradesilvania website is for informational purposes only and should not be considered as investment advice, financial advice, trading advice, or any other form of advice. We do not endorse or recommend the buying, selling, or holding of any cryptocurrency. It is important that you conduct your own research and consult with a financial advisor before making any investment decisions. We cannot be held responsible for any investment choices made based on the information presented on our website.
The information in this report was obtained from public sources and is considered relevant and reliable within the limits of publicly available data. However, the value of the digital assets referred to in this report fluctuates over time, and past performance does not indicate future growth.
Total or partial reproduction of this report is permitted only by mentioning the source.