
Crypto Market update and analysis for BTC, ETH, EGLD, DOT and SOL - March 21, 2024

Crypto Market in the last 24h:
🌐 Global Market Cap: $2.53T (+5.34%)
📉 24h Volume: $151.61B (-6.02%)
💼 DeFi Volume: $12.95B (8.54% of total volume)
💱 Stablecoins Volume: $135.43B (89.33% of total volume)
🅱️ Bitcoin Dominance: 51.95% (-0.12%)
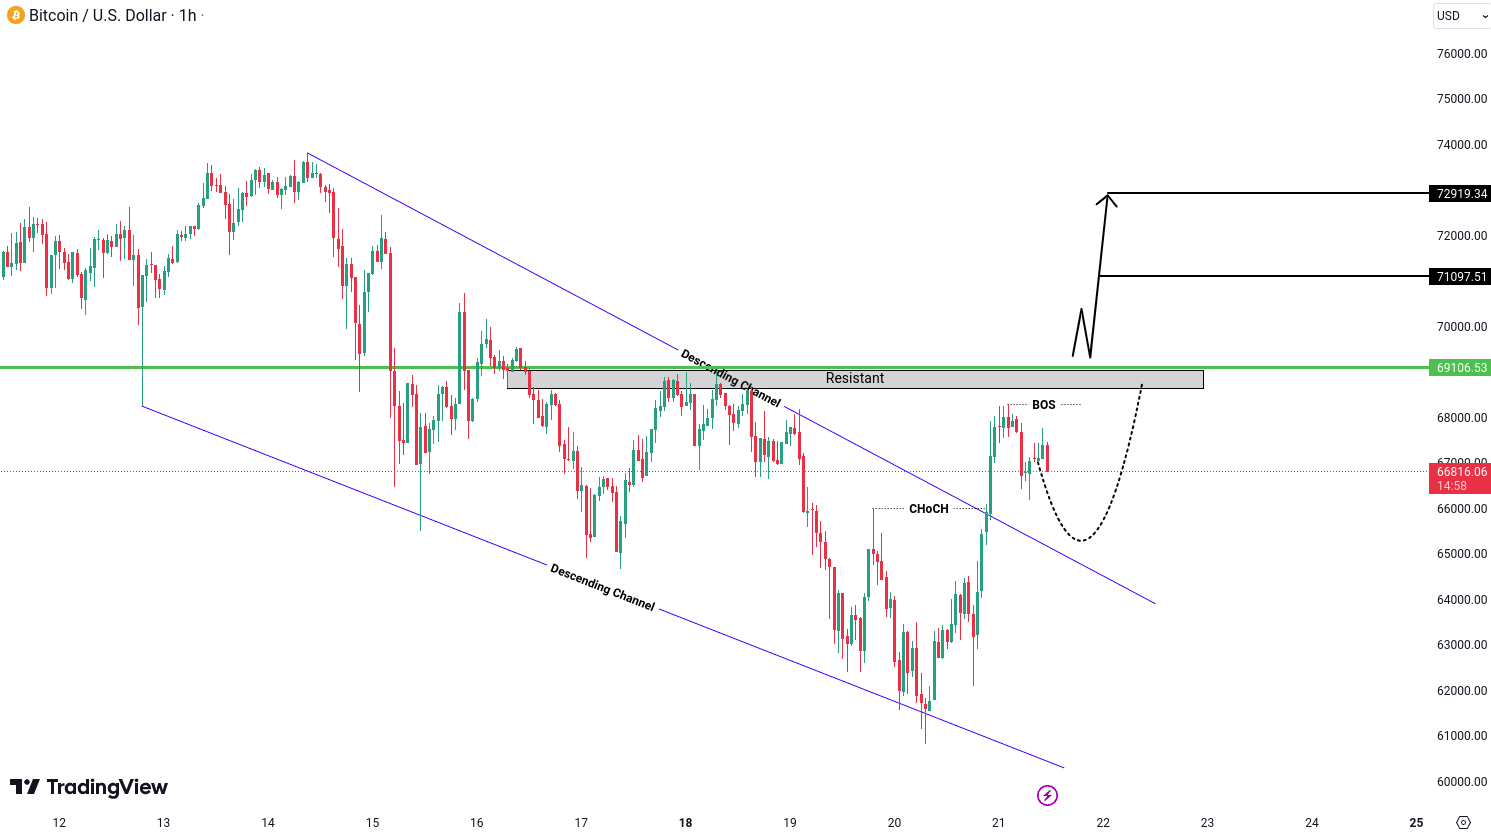
BTC (Bitcoin) Analysis
BTC had a change in character (CHoCH) towards a bullish market structure, indicated by a breakout from a descending channel. This suggests a shift in sentiment towards bullishness. However, after such a breakout, it’s common to see some consolidation as traders assess the new landscape. For confirmation of further bullish momentum, we’ll be looking for a price move above the level of 69,106.98 USD. If the price manages to break above this level, it could signal a continuation of the upward trend, with potential targets around 71,097.98 USD and 72,919.98 USD.
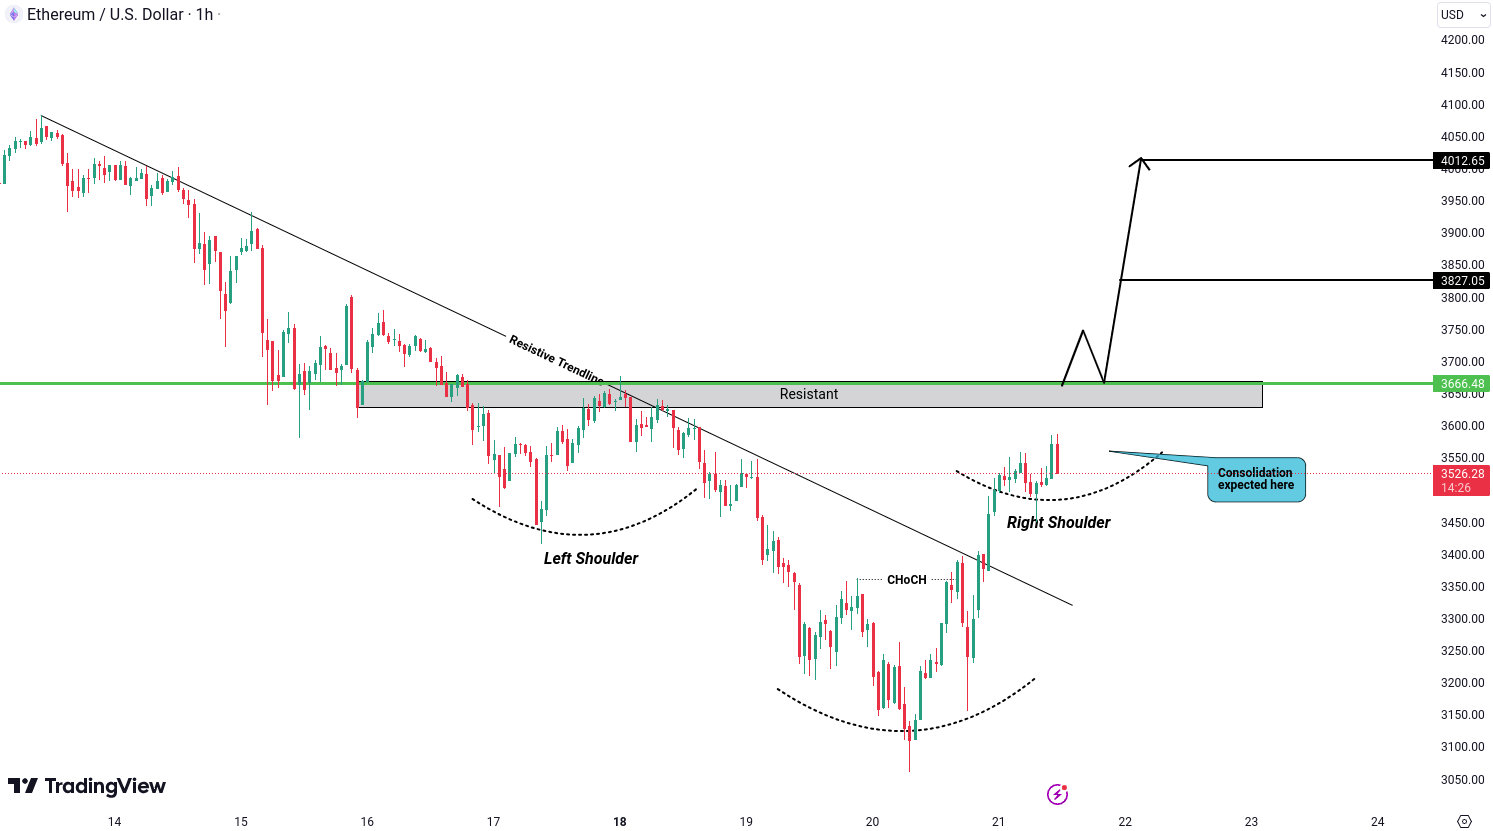
ETH (Ethereum) Analysis
ETH witnessed a breakout above a resistive trendline, indicating a potential shift towards bullish sentiment. Additionally, we’re observing the formation of an inverse head and shoulders pattern, which further strengthens the case for a bullish move. The price action has also displayed a change of character (CHoCH), adding to the bullish outlook. For confirmation of this upward momentum, we’ll be closely watching for a price breakout above the level of 3,666.98 USD. If the price manages to surpass this level, it would mark a new higher high and could pave the way for further gains. Potential targets to keep in mind are around 3,827.98 USD and 4,012.98 USD.
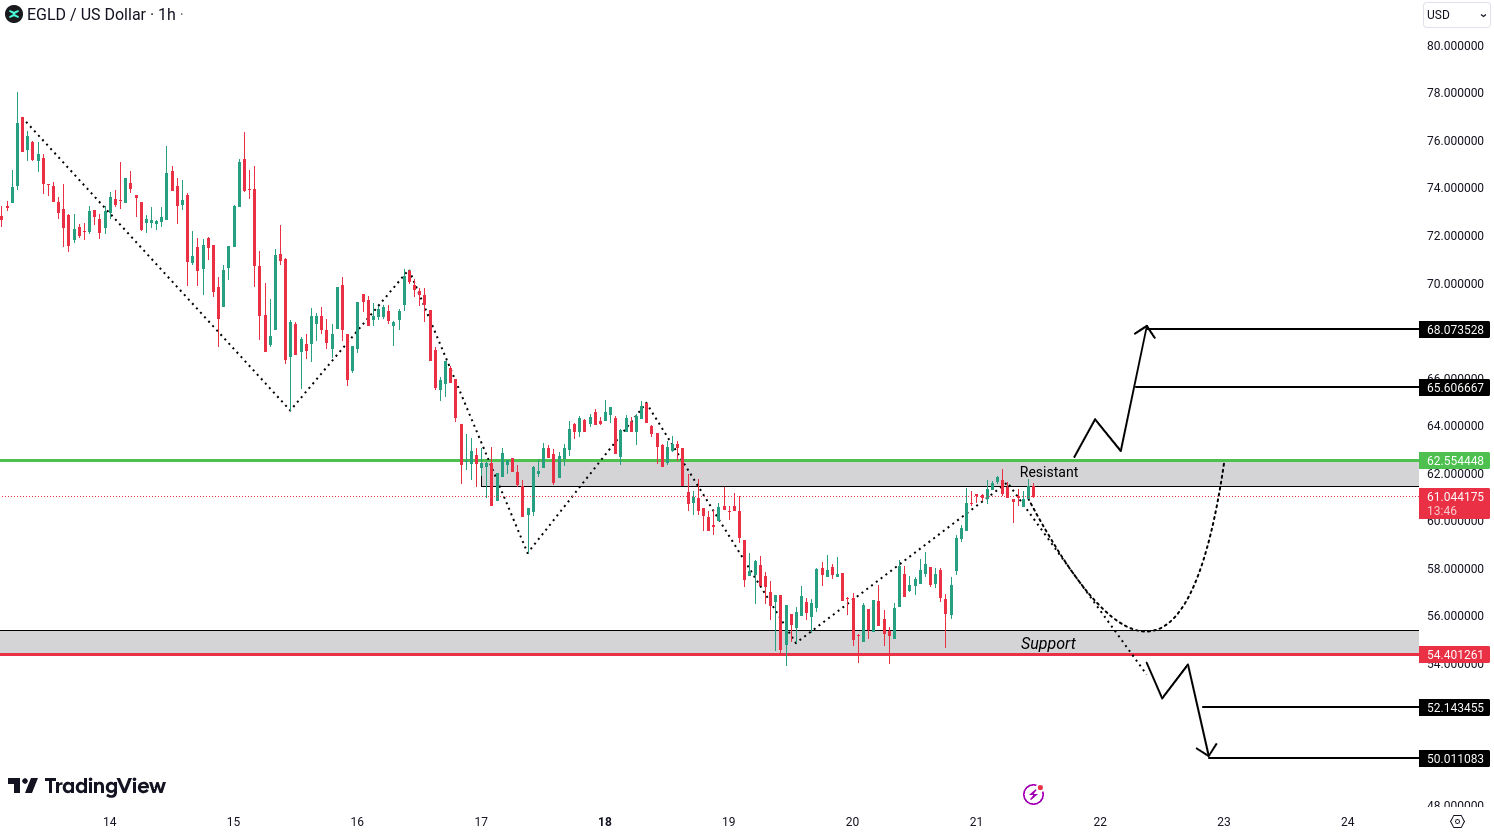
EGLD (MultiversX) Analysis
EGLD is presenting opportunities for both bullish and bearish sides, but the current price action leans more towards the bearish side. The price has been forming lower lows and lower highs, indicating a downward trend. However, if the price manages to break above the resistance level of 62.554 USD, it could signal a change of character (CHoCH) towards a bullish market structure. In such a scenario, we could anticipate targets around the next resistance levels of 65.606 USD and 68.073 USD. On the other hand, if the price breaks below the support level of 54.401 USD, it would suggest that the price is still following the downward trend. In this case, we might expect targets around the levels of 52.143 USD and 50.011 USD.
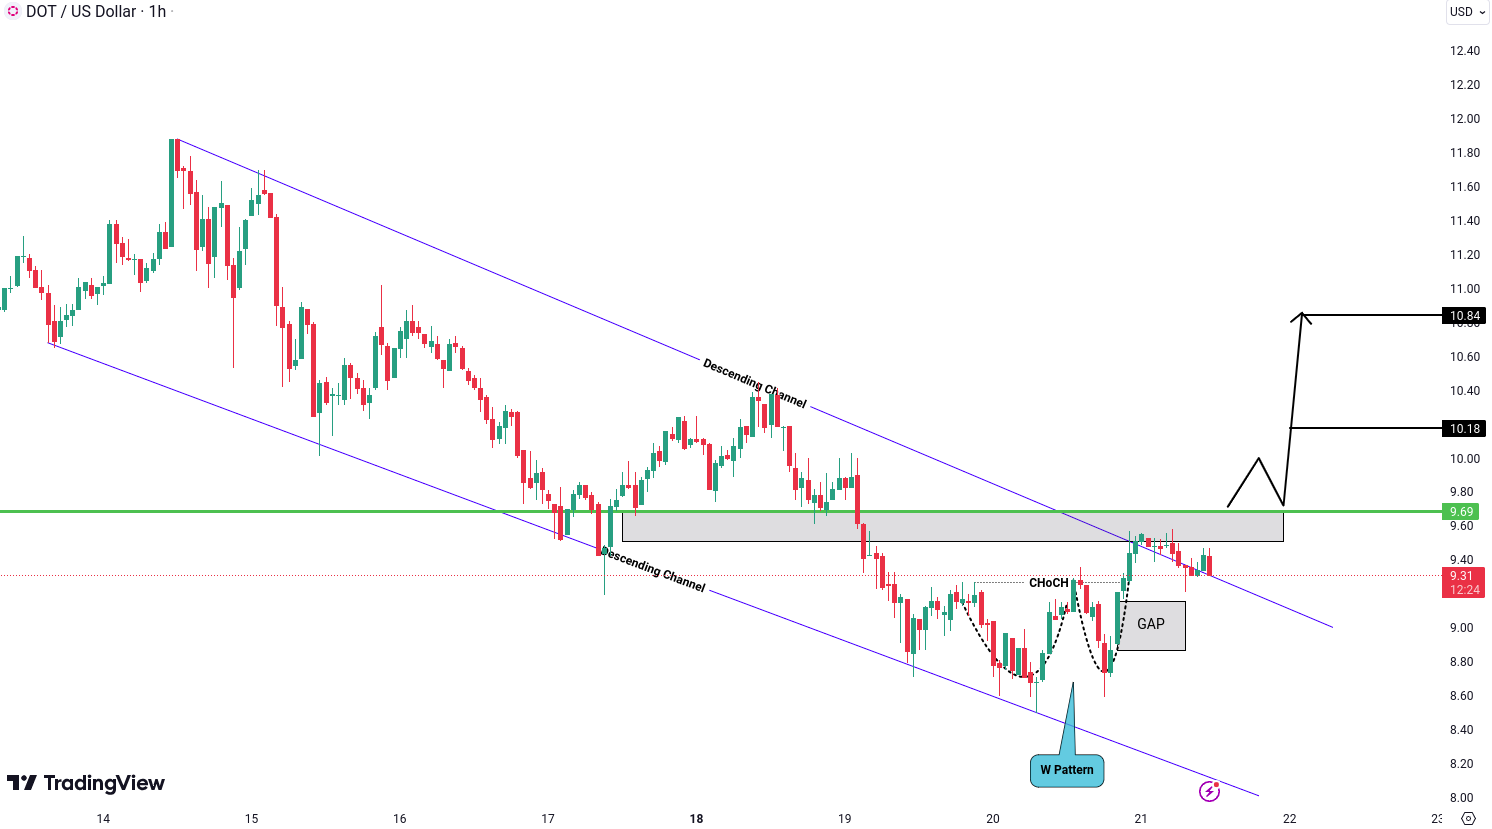
DOT (Polkadot) Analysis
DOT had a breakout from a descending channel, accompanied by the formation of a W pattern. These developments are increasing the likelihood of a bullish move ahead. To confirm this bullish sentiment, we’re looking for a breakout above the level of 9.69 USD. Once this breakout occurs, it could propel the price towards our targets at 10.18 USD and 10.84 USD.
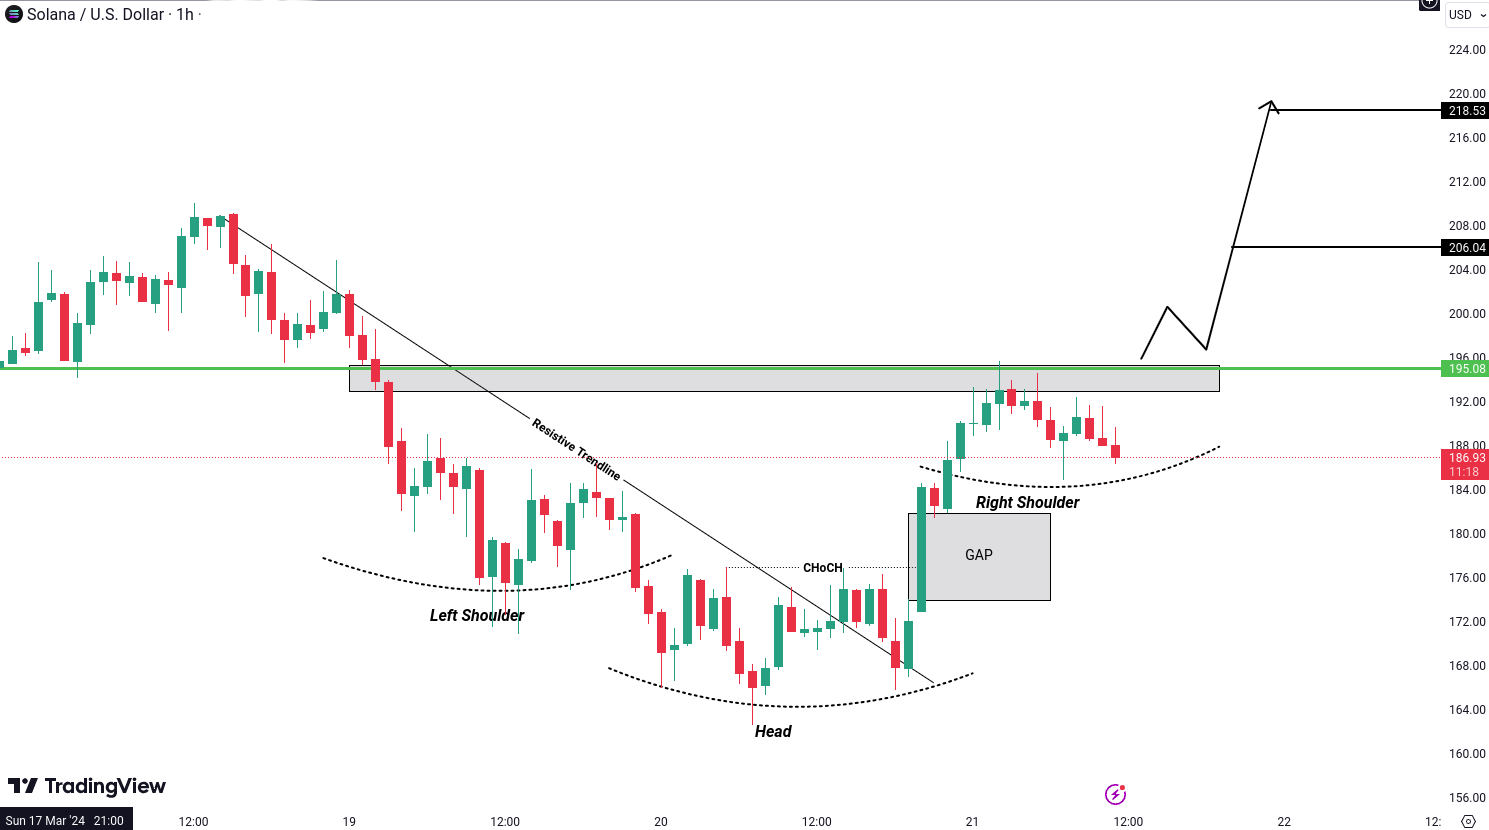
SOL (Solana) Analysis
SOL has given a breakout from a resistive trendline, indicating potential bullish momentum. Additionally, an inverse head and shoulders pattern is formed, with the right shoulder currently in the process. Once the price breaks above the neckline level of 195.08 USD, it could signal a confirmation of the pattern. This breakout may lead to further upward movement, with potential targets at levels around 206 USD and 218 USD.
Do you agree with our analysis and interpretation of the market?
Want to learn more or have a different perspective?
Let's discuss it in the Tradesilvania community 👉 Telegram Group
All cryptocurrencies are available for trading on Tradesilvania , and their prices can be seen on the Tradesilvania price page, accessible through the following link: https://tradesilvania.com/en/prices
With the help of our platform, you can deposit, withdraw, buy, or sell any of these cryptocurrencies using the free digital wallet.
SEPA Top-up (On-Ramp & Off-Ramp) Euro and RON instant transfers and over 100 cryptocurrencies, are all available in our app.
Limitation of Liability
This report issued by Tradesilvania is purely informative and is not intended to be used as a tool for making investment decisions in crypto-assets. Any person who chooses to use this report in the process of making investment decisions assumes all related risks. Tradesilvania SRL has no legal or other obligation towards the person in question that would derive from the publication of this report publicly.
The content provided on the Tradesilvania website is for informational purposes only and should not be considered as investment advice, financial advice, trading advice, or any other form of advice. We do not endorse or recommend the buying, selling, or holding of any cryptocurrency. It is important that you conduct your own research and consult with a financial advisor before making any investment decisions. We cannot be held responsible for any investment choices made based on the information presented on our website.
The information in this report was obtained from public sources and is considered relevant and reliable within the limits of publicly available data. However, the value of the digital assets referred to in this report fluctuates over time, and past performance does not indicate future growth.
Total or partial reproduction of this report is permitted only by mentioning the source.