
Crypto Market update and analysis for BTC, ETH, EGLD, ALGO and SOL - February 26, 2024

Crypto in the last 24h
💸 Global crypto market cap: $1.98T ⬇️ 0.14% (24h)
💼 Total market volume: $57.97B ⬆️ 16.66%
🚀 DeFi volume: $5.76B 💹 9.94%
💳 Stablecoins volume: $51.89B 💰 89.51%
🔍 Bitcoin dominance: 50.71% ⬇️ 0.35%
Bitcoin (BTC) Analysis
BTC/USD is in a bullish trend. Currently, BTC is forming a “double-bottom” pattern, a significant indicator of a potential bullish reversal. Furthermore, there’s a formation of an “inverse head and shoulders” pattern, further increasing the probability of a bullish move.
For confirmation of this bullish sentiment, we need an above-the-price level of $52,129.98. Once this level is breached, it could signal a clear path towards the $52,998.98 and $53,662.98 targets, respectively.

Ethereum (ETH) Analysis
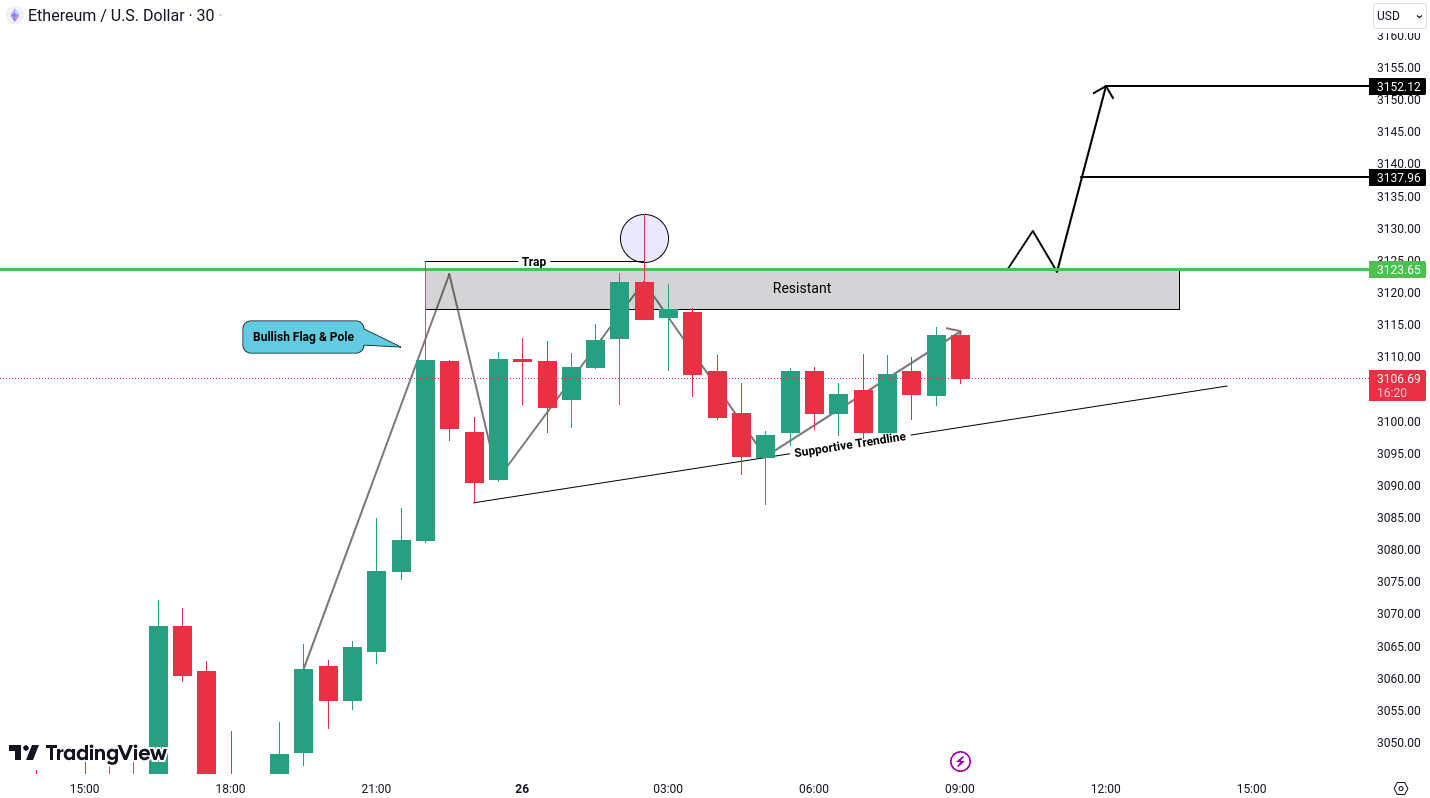
ETH/USD is forming a “bullish flag and pole”, a common trend continuation formation in technical analysis. Alongside this pattern, there’s a notable supportive trendline that’s pushing the price upward on the price action.
While these indicators suggest a bullish outlook for Ethereum, it’s important to await confirmation before taking decisive action. For confirmation, we need a breakout above the level of $3,123.98. This breakout could serve as a strong signal for potential further upward movement, with targets projected at $3,137.98 and $3,152.98, respectively.
MultiversX (EGLD) Analysis
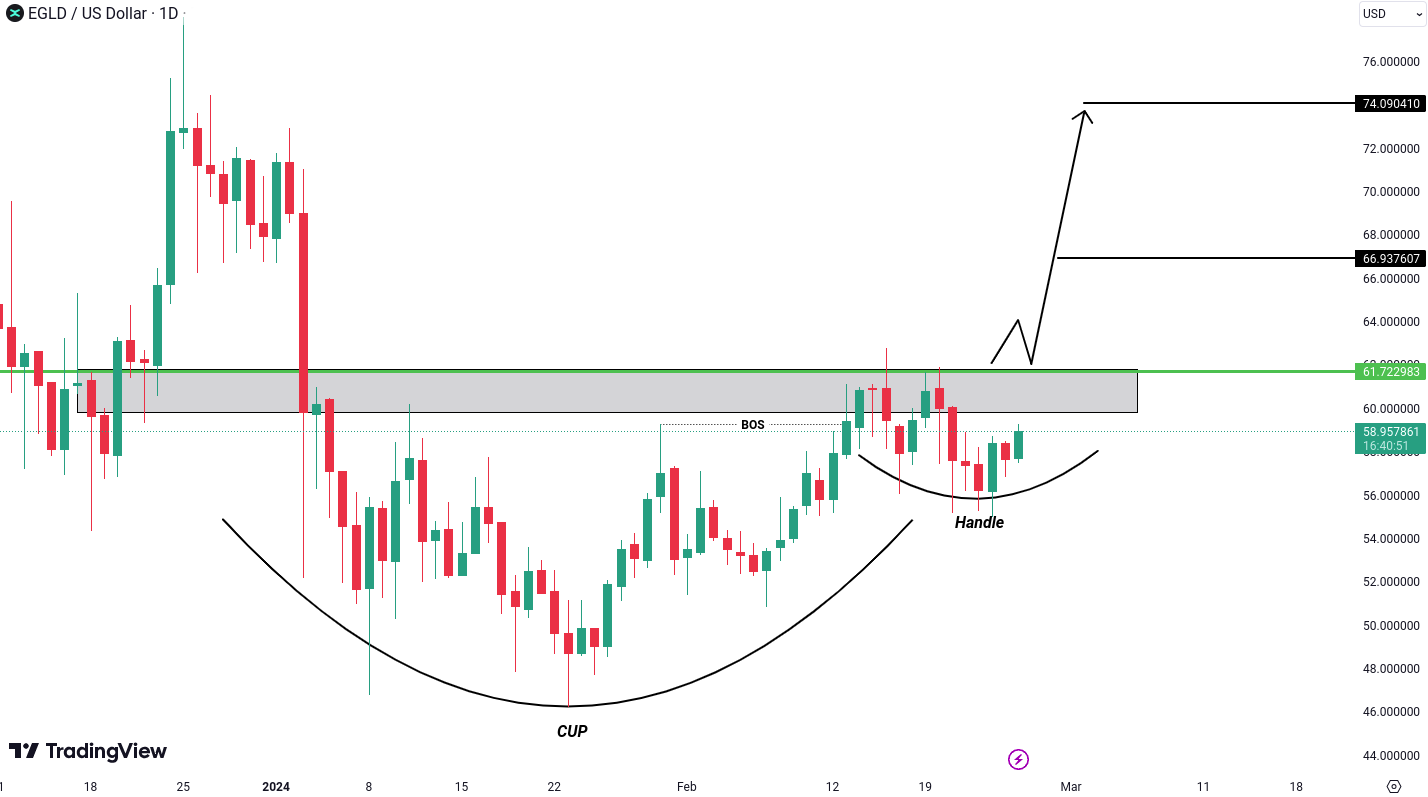
EGLD/USD is forming a “cup and handle” pattern, a classic bullish reversal formation. This pattern typically signifies a shift from a downtrend to an uptrend, indicating potential opportunities for traders to capitalize. The pattern will be validated if the price breakout above the level of $61.72, which can open the doors for target levels of $66.93 and $74.09.
Algorand (ALGO) Analysis
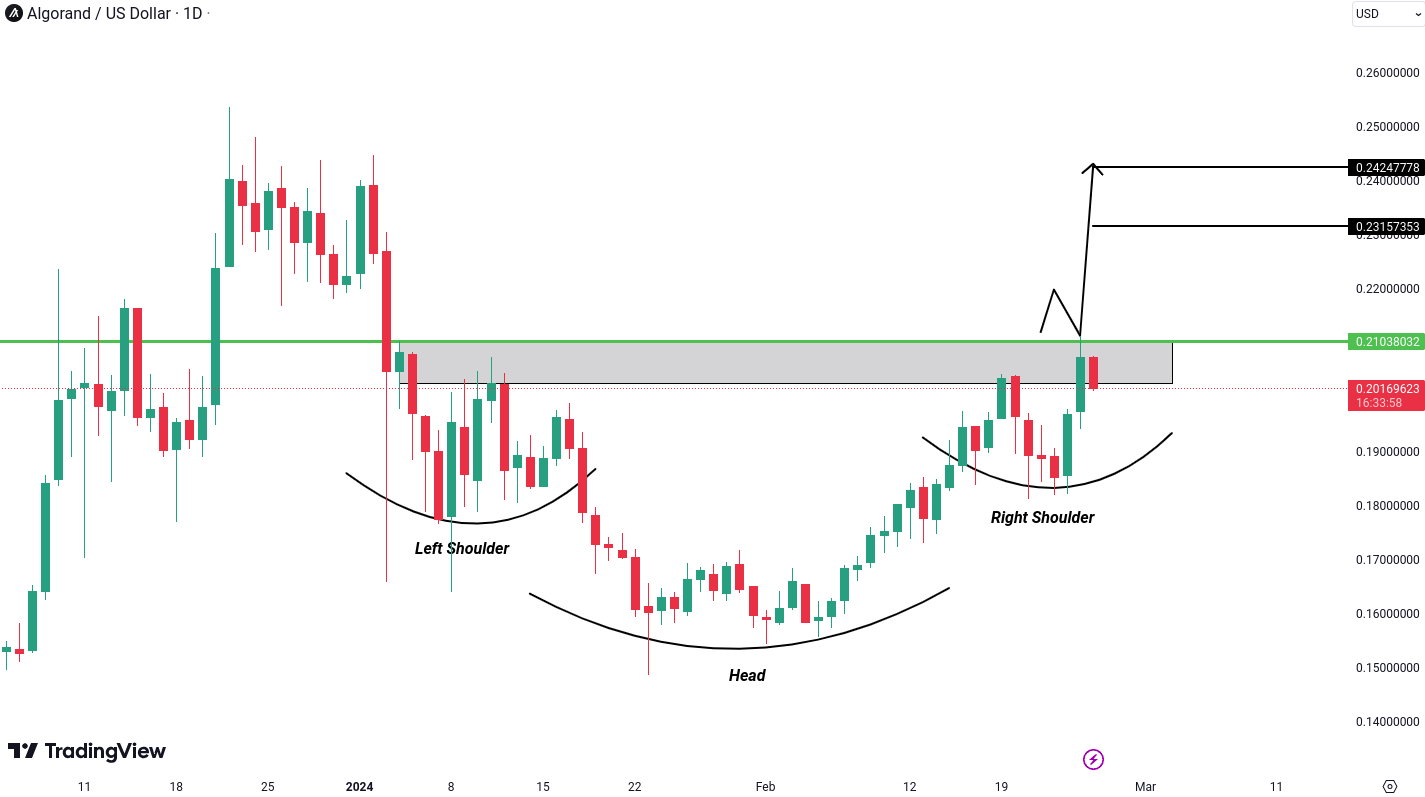
ALGO/USD is forming an “inverse head and shoulders” pattern, indicating a potential shift from a bearish market structure to a bullish one. This pattern is widely recognized in technical analysis as a bullish reversal formation, suggesting a change in market sentiment.
Confirmation of this pattern would require a breakout above the key level of $0.2103. Once this breakout occurs, it could signal a strong indication of further upward movement, potentially leading to the target levels of $0.2315 and $0.2424.
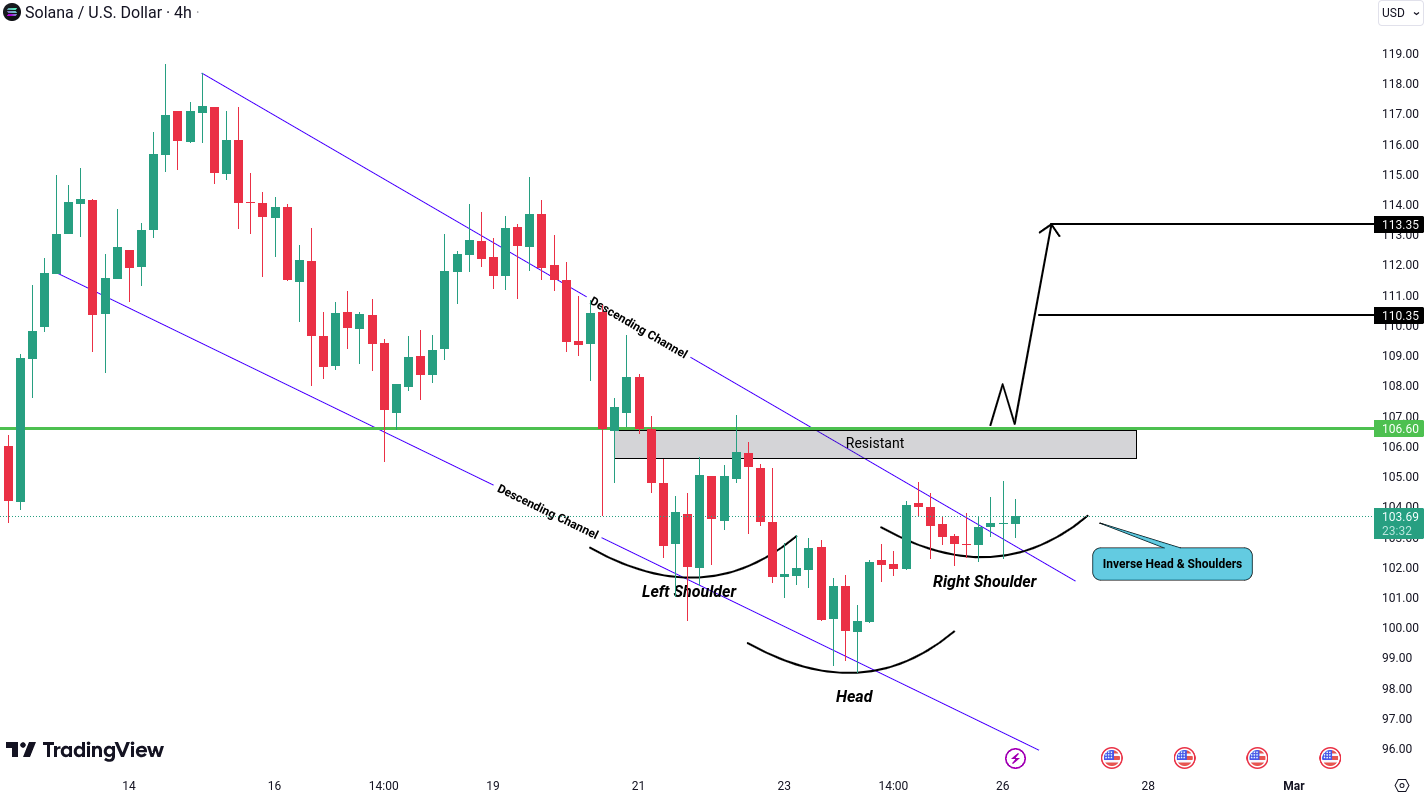
Solana (SOL) Analysis
SOL/USD has recently broken out of a descending channel, showing a significant shift in market dynamics. Additionally, the formation of an “inverse head and shoulders” pattern further increases the bullish sentiment, indicating a potential reversal from a downtrend to an uptrend.
For confirmation, we need a breakout above the key level of $106.60. Once this breakout occurs, it could provide a strong indication of continued upward momentum, potentially opening the way for targets around $110.35 and $113.25.
Do you agree with our analysis and interpretation of the market?
Want to learn more or have a different perspective?
Let's discuss it in the Tradesilvania community 👉 Telegram Group
All cryptocurrencies are available for trading on Tradesilvania , and their prices can be seen on the Tradesilvania price page, accessible through the following link: https://tradesilvania.com/en/prices
With the help of our platform, you can deposit, withdraw, buy, or sell any of these cryptocurrencies using the free digital wallet.
SEPA Top-up (On-Ramp & Off-Ramp) Euro and RON instant transfers and over 100 cryptocurrencies, are all available in our app.
Limitation of Liability
This report issued by Tradesilvania is purely informative and is not intended to be used as a tool for making investment decisions in crypto-assets. Any person who chooses to use this report in the process of making investment decisions assumes all related risks. Tradesilvania SRL has no legal or other obligation towards the person in question that would derive from the publication of this report publicly.
The content provided on the Tradesilvania website is for informational purposes only and should not be considered as investment advice, financial advice, trading advice, or any other form of advice. We do not endorse or recommend the buying, selling, or holding of any cryptocurrency. It is important that you conduct your own research and consult with a financial advisor before making any investment decisions. We cannot be held responsible for any investment choices made based on the information presented on our website.
The information in this report was obtained from public sources and is considered relevant and reliable within the limits of publicly available data. However, the value of the digital assets referred to in this report fluctuates over time, and past performance does not indicate future growth.
Total or partial reproduction of this report is permitted only by mentioning the source.