
Crypto Market update and analysis for BTC, ETH, EGLD, GALA and SUI - February 20, 2024

Crypto Market evolution in the last 24 hours
📊 Global crypto cap: $1.97T (↓0.14%)
📈 24h market volume: $80.38B (↑30.32%)
💸 DeFi volume: $6.67B (8.30%)
💰 Stablecoins volume: $72.36B (90.02%)
🔗 Bitcoin dominance: 51.67% (↓0.10%)
Bitcoin (BTC) Analysis
BTC/USD presents opportunities for both bulls and bears. On the bullish front, Bitcoin is showing a bullish market structure, with potential for an upward move if it breaks out above the 52769 USD level, signaling a flag and pole formation. In such a scenario, we could expect targets around 55362 USD and 58000 USD. However, there are signs of caution on the bearish side, with Bitcoin forming an M pattern with a bearish divergence in the MACD indicator. We’ll closely monitor for a breakdown below the 50010 USD level to confirm this bearish sentiment. If this occurs, we might see targets at 48363 USD and 46705 USD.

Ethereum (ETH) Analysis
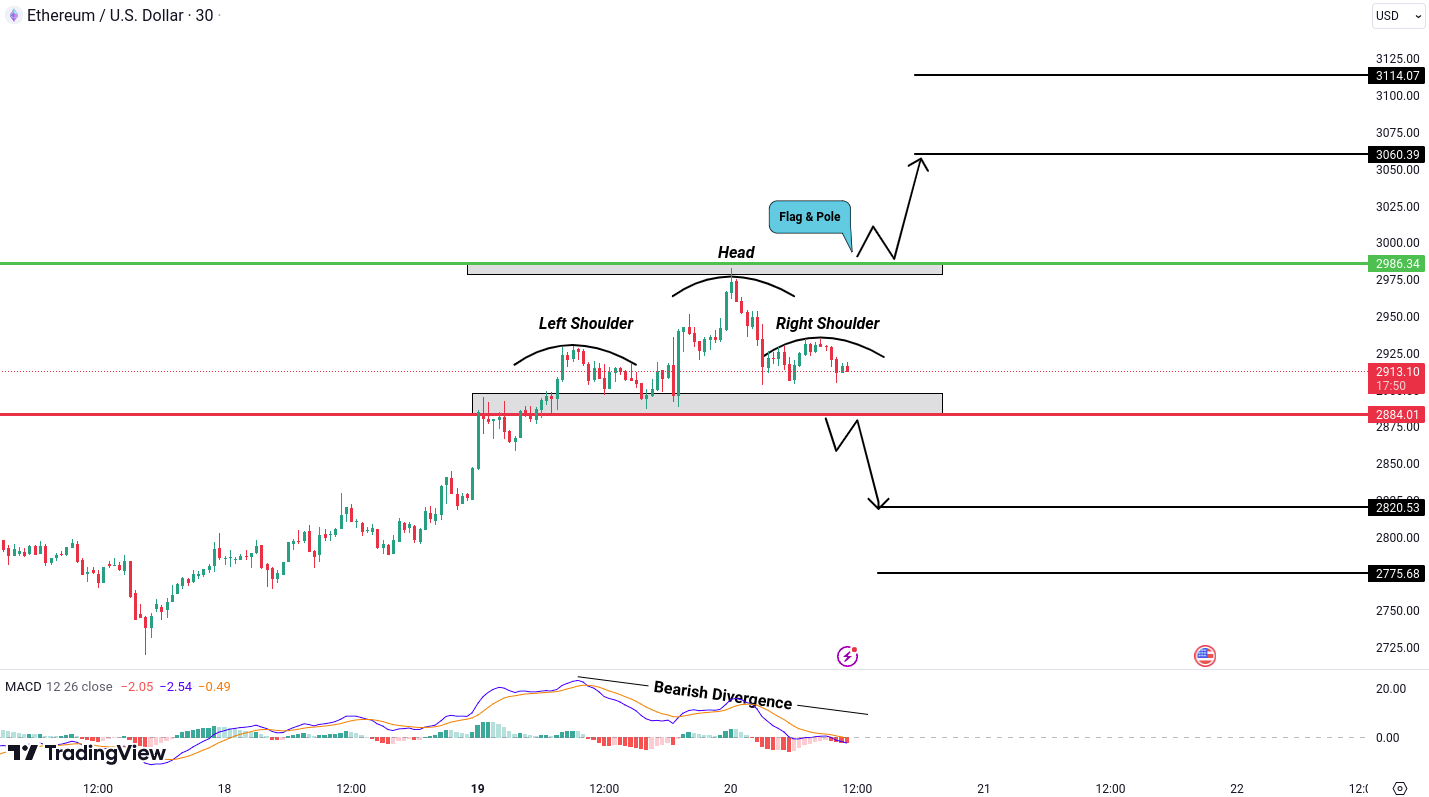
ETH/USD is riding the bullish trend, Ethereum’s upward momentum remains intact, with potential for further gains upon a breakout above the 2986 USD level. In such a scenario, we could set our sights on targets around 3060 USD and 3114 USD because of the flag & pole pattern. However, caution is warranted as signs of a bearish reversal emerge, characterized by a head and shoulders pattern with bearish divergence. We’ll closely monitor for a breakdown below the 2884 USD level to confirm this bearish sentiment. Should this occur, we might see targets at 2820 USD and 2775 USD.
MultiversX (EGLD) Analysis
The bullish market structure of EGLD is evident through the Change of Character (CHoCH) and Break of Structure (BOS) in price pointing towards a bullish trend, increasing the probability of a bullish move. However, to solidify this outlook, a breakout above the 61.69 USD level is needed which is considered as the breakout of flag and pole pattern. Such a breakout could open the way for targets at 65.30 USD and 68.25 USD. Conversely, a shift in momentum could occur if prices fall and break below the 54.99 USD level, marking the breakdown of the M pattern. In this scenario, targets at 52.32 USD and 50.61 USD come into play, providing potential opportunities for bearish moves.

Gala Games (GALA) Analysis
A potential bullish opportunity is on the horizon as the price forms an inverse head and shoulders pattern. This pattern, known for its bullish reversals, aligns with the existing bullish trend in GALA, further enhancing the likelihood of a bullish move. However, for confirmation of this outlook, we await a breakout above the critical level of 0.0290 USD. Such a breakout could unleash a flurry of buying activity, propelling GALA towards targets at 0.0325 USD and 0.0360 USD.

SUI (SUI) Analysis
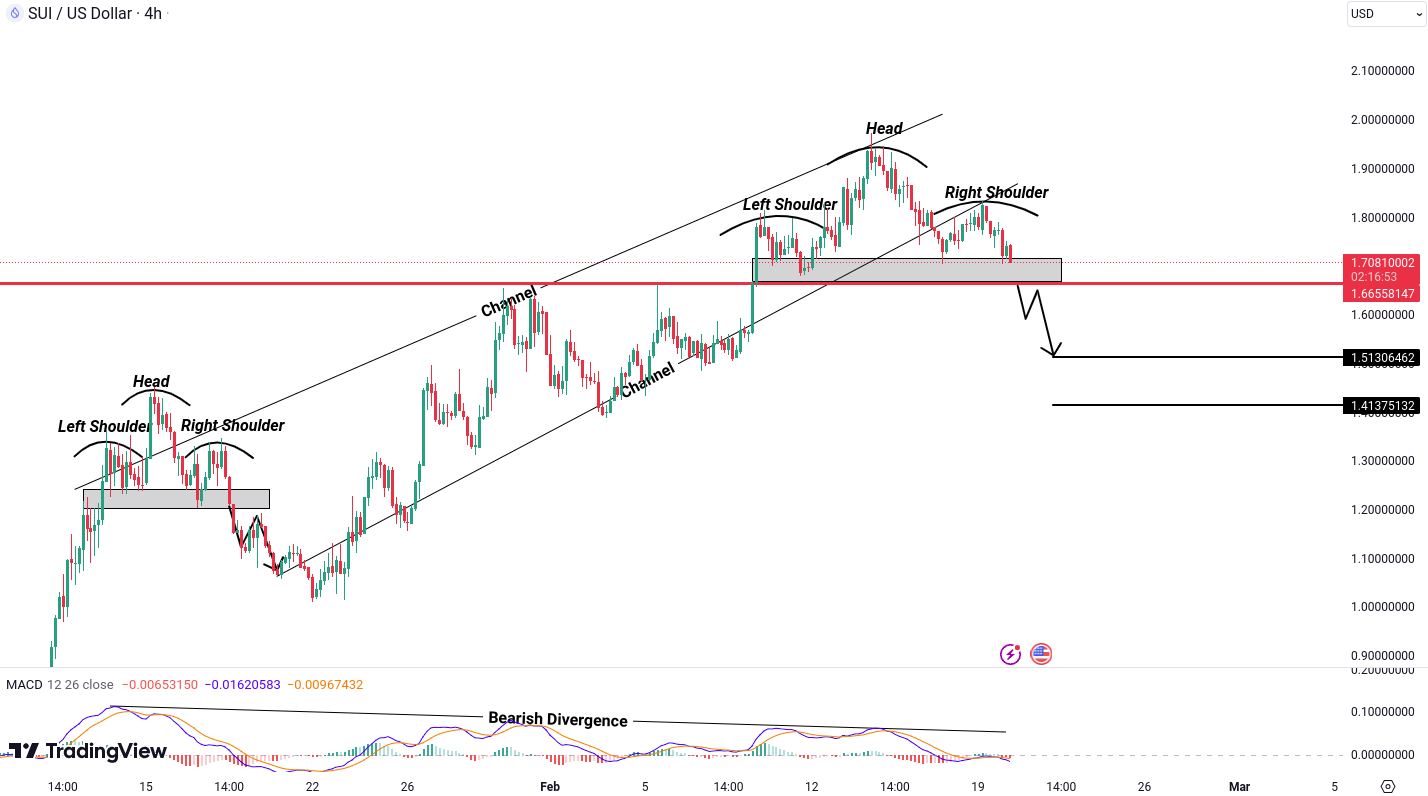
SUI/USD shows a bearish structure as its price breaks down the ascending channel and forms an inverse head and shoulders pattern. This pattern, known for its bearish implications, is compounded by historical evidence of previous bearish movements following similar patterns. To confirm this current outlook, we need a breakdown below the crucial level of 1.665 USD. Such a breakdown could trigger further selling pressure, leading SUI/USD towards targets at 1.513 USD and 1.413 USD
Do you agree with our analysis and interpretation of the market?
Want to learn more or have a different perspective?
Let's discuss it in the Tradesilvania community 👉 Telegram Group
All cryptocurrencies are available for trading on Tradesilvania , and their prices can be seen on the Tradesilvania price page, accessible through the following link: https://tradesilvania.com/en/prices
With the help of our platform, you can deposit, withdraw, buy, or sell any of these cryptocurrencies using the free digital wallet.
SEPA Top-up (On-Ramp & Off-Ramp) Euro and RON instant transfers and over 100 cryptocurrencies, are all available in our app.
Limitation of Liability
This report issued by Tradesilvania is purely informative and is not intended to be used as a tool for making investment decisions in crypto-assets. Any person who chooses to use this report in the process of making investment decisions assumes all related risks. Tradesilvania SRL has no legal or other obligation towards the person in question that would derive from the publication of this report publicly.
The content provided on the Tradesilvania website is for informational purposes only and should not be considered as investment advice, financial advice, trading advice, or any other form of advice. We do not endorse or recommend the buying, selling, or holding of any cryptocurrency. It is important that you conduct your own research and consult with a financial advisor before making any investment decisions. We cannot be held responsible for any investment choices made based on the information presented on our website.
The information in this report was obtained from public sources and is considered relevant and reliable within the limits of publicly available data. However, the value of the digital assets referred to in this report fluctuates over time, and past performance does not indicate future growth.
Total or partial reproduction of this report is permitted only by mentioning the source.