Crypto Market update and analysis for BTC, ETH, EGLD, LTC & AVAX - November 2, 2023


Crypto Market in the last 24h:
📈 Global crypto market cap: €1.21T (+1.60%)
📊 Total 24-hour crypto market volume: €54.72B (+36.64%)
💼 DeFi volume: €5.99B (10.95%)
💰 Stablecoins volume: €48.94B (89.44%)
📊 Bitcoin dominance: 52.77% (+0.04%)
Bitcoin (BTC) Analysis
BTC/EUR showed some bullishness last night and subsequently formed a bearish engulfing pattern near our resistance area. Currently, we’re observing a bearish divergence on the MACD, signaling a potential downward movement. To confirm this bearish sentiment, a breakdown below the 31,369 Euro levels is necessary, potentially leading to targets around 30,067 Euro and 29,306 Euro. It’s important to note a riskier level at 32,976 Euro, which could trap breakout traders, potentially resulting in a bearish downturn. Traders consider smaller position sizes to manage this risky entry effectively.

Ethereum (ETH) Analysis
ETH/EUR has recently shown a double top pattern and bearish divergence on the MACD within the 4-hour time frame. However, considering the bullish sentiment in the overall market, I am looking for an M pattern because it’s better than a double top. If the price dips below the 1,632 Euro level, we can expect a fall towards 1,582 Euro and 1,551 Euro.
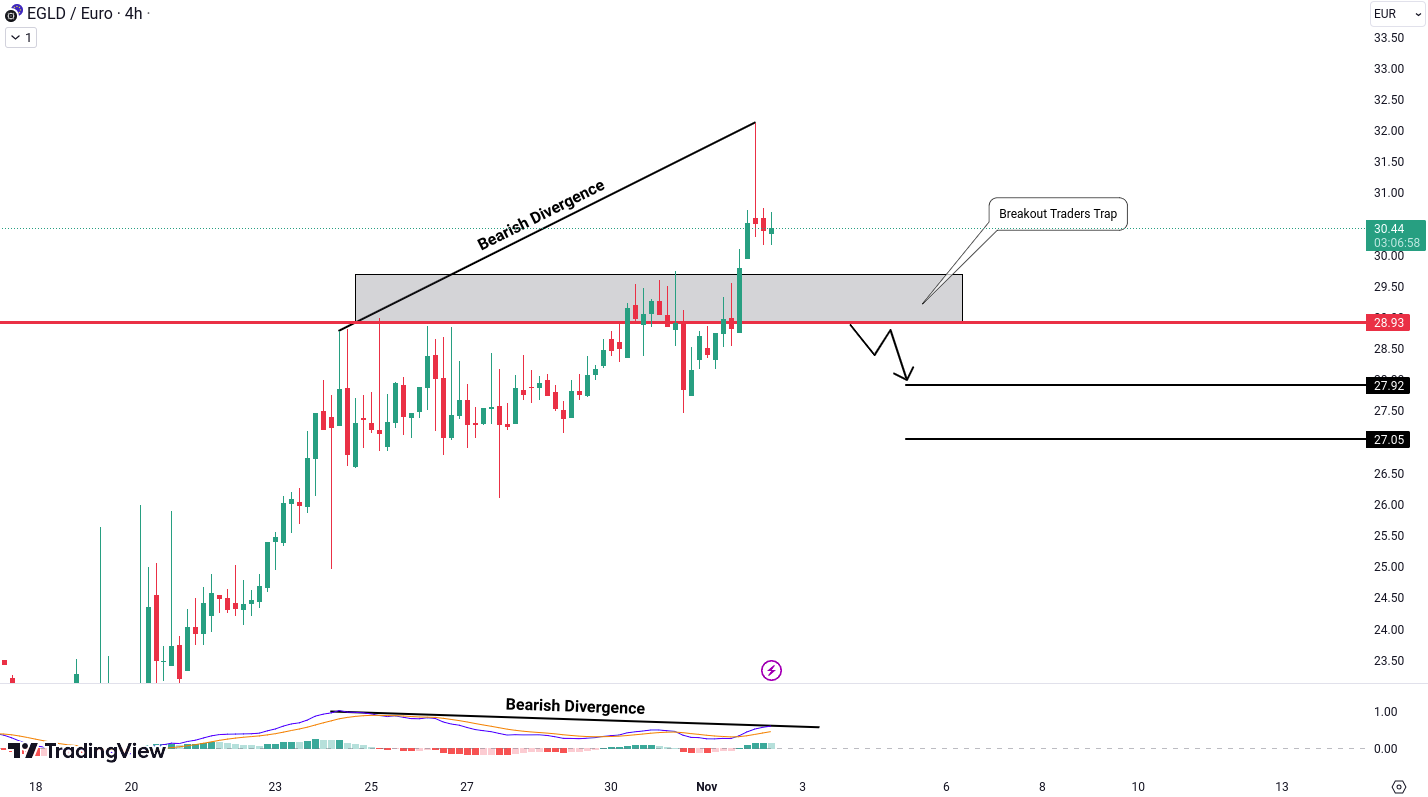
MultiversX (EGLD) Analysis
EGLD/EUR is forming a bearish divergence within the 4-hour time frame. To capture a potential bearish move, we must observe a breakdown of the previous higher low, which shifts EGLD’s trend toward the bearish side. For confirmation of this pattern, we will be looking for a breakdown below the 28.93 Euro level, setting the targets at 27.92 Euro and 27.05 Euro.

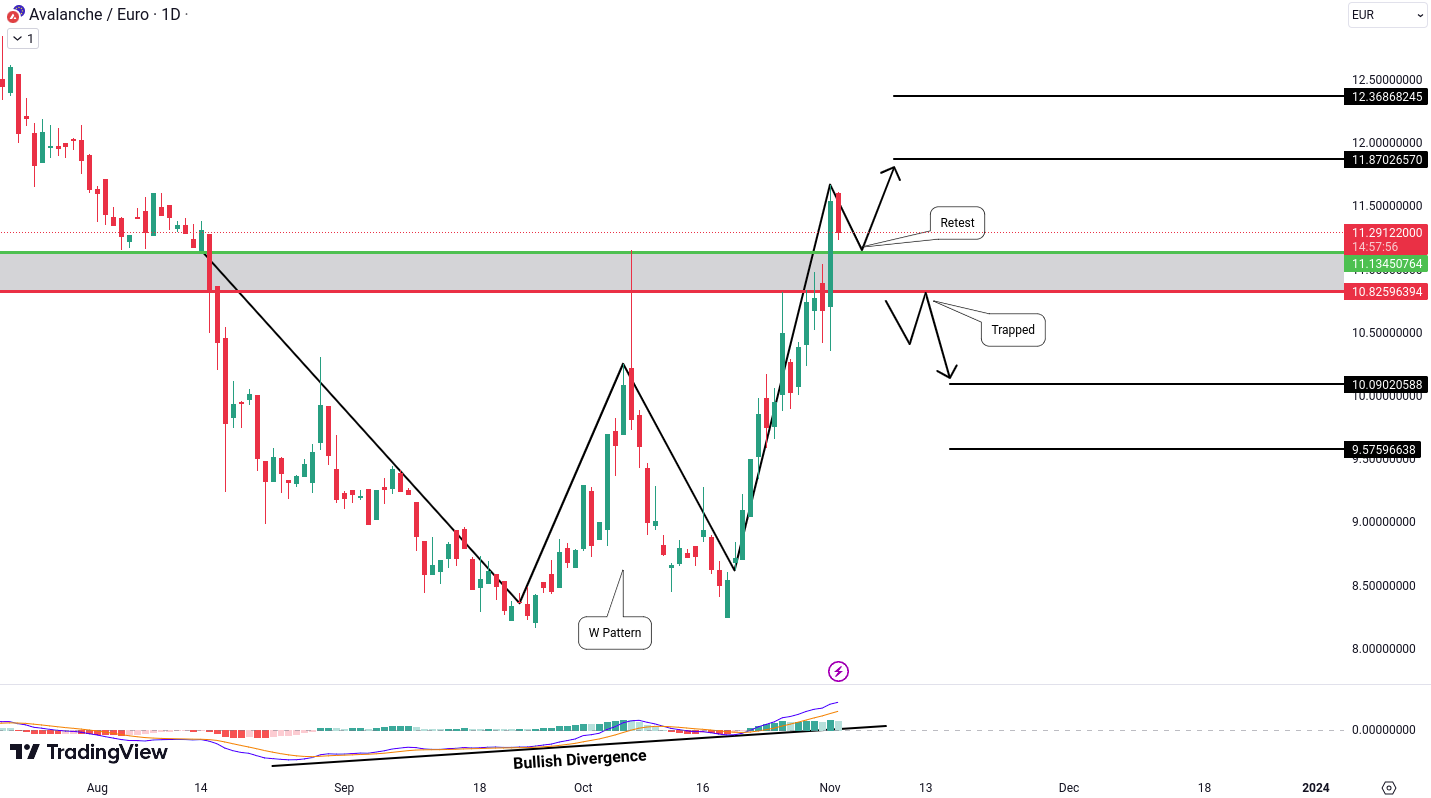
Avalanche (AVAX) Analysis
AVAX/EUR is currently shaping a W pattern, complemented by a bullish divergence visible in the MACD within the daily time frame. The asset has already broken through the confirmation zone and it is likely to retest or trap breakout traders by dipping below the breakout level. To capture a potential bullish move, we can look for a price retest around 11.1345 Euro, anticipating targets near the 11.8702 Euro and 12.3686 Euro levels. On the other hand, for a strategic play to trap breakout traders, a breakdown below the 10.8259 Euro level could pave the way for a movement toward 10.0902 Euro and 9.5759 Euro.
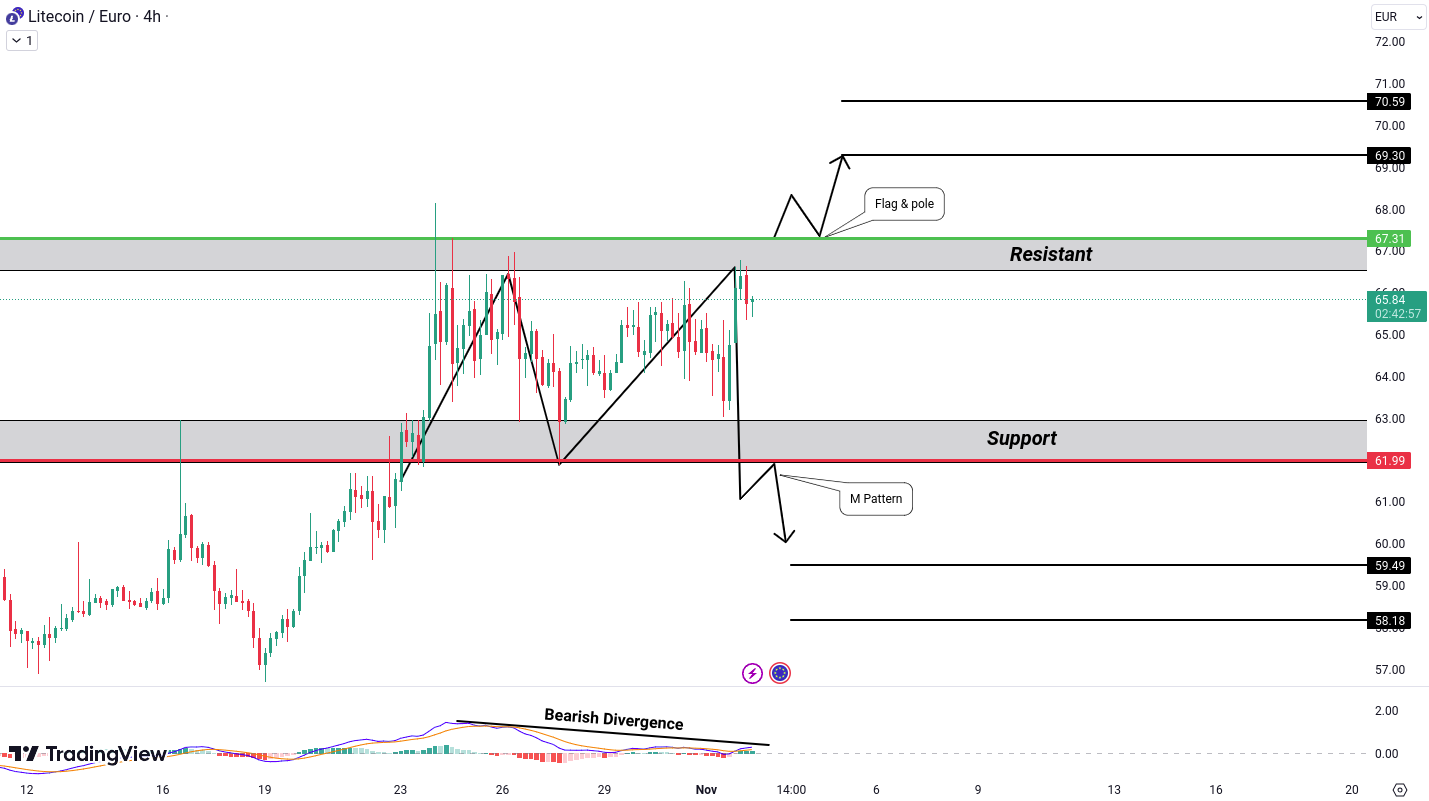
Litecoin (LTC) Analysis
LTC/EUR is in an interesting phase where it could potentially experience a breakout of the flag and pole pattern. Conversely, a decline might see the formation of an M pattern. There is also a bearish divergence in the 4-hour time frame. These patterns suggest opportunities for both bullish and bearish positions. Now all we need is confirmation. To trigger a bullish scenario, a breakout above 67.31 Euro could push the price towards 69.30 Euro and 70.59 Euro because of the flag and pole pattern. On the other hand, if it dips below the 61.99 Euro level, the path to 59.49 Euro and 58.18 Euro might unfold due to the M pattern with bearish divergence.
Do you agree with our analysis and interpretation?
Want to learn more or have a different perspective?
Let's discuss it in the Tradesilvania community 👉 Telegram Group
All cryptocurrencies are available for trading on Tradesilvania , and their prices can be seen on the Tradesilvania price page, accessible through the following link: https://tradesilvania.com/en/prices
With the help of our platform, you can deposit, withdraw, buy, or sell any of these cryptocurrencies using the free digital wallet.
SEPA Top-up (On-Ramp & Off-Ramp) Euro and RON instant transfers and over 100 cryptocurrencies, are all available trought our app.