
Crypto Market update and analysis for BTC, ETH, EGLD, PEPE and SOL - April 29, 2024

Crypto Market in the last 24h:
🌐 Global market cap: $2.31T (-2.88%)
💹 Total volume 24h: $58.29B (+10.36%)
🔗 DeFi Volume (of total): $5.4B (9.27% of total volume)
💰 Stablecoin Volume: $52.81B (90.60% of total volume)
🔝 Bitcoin Dominance: 53.16% (+0.35%)
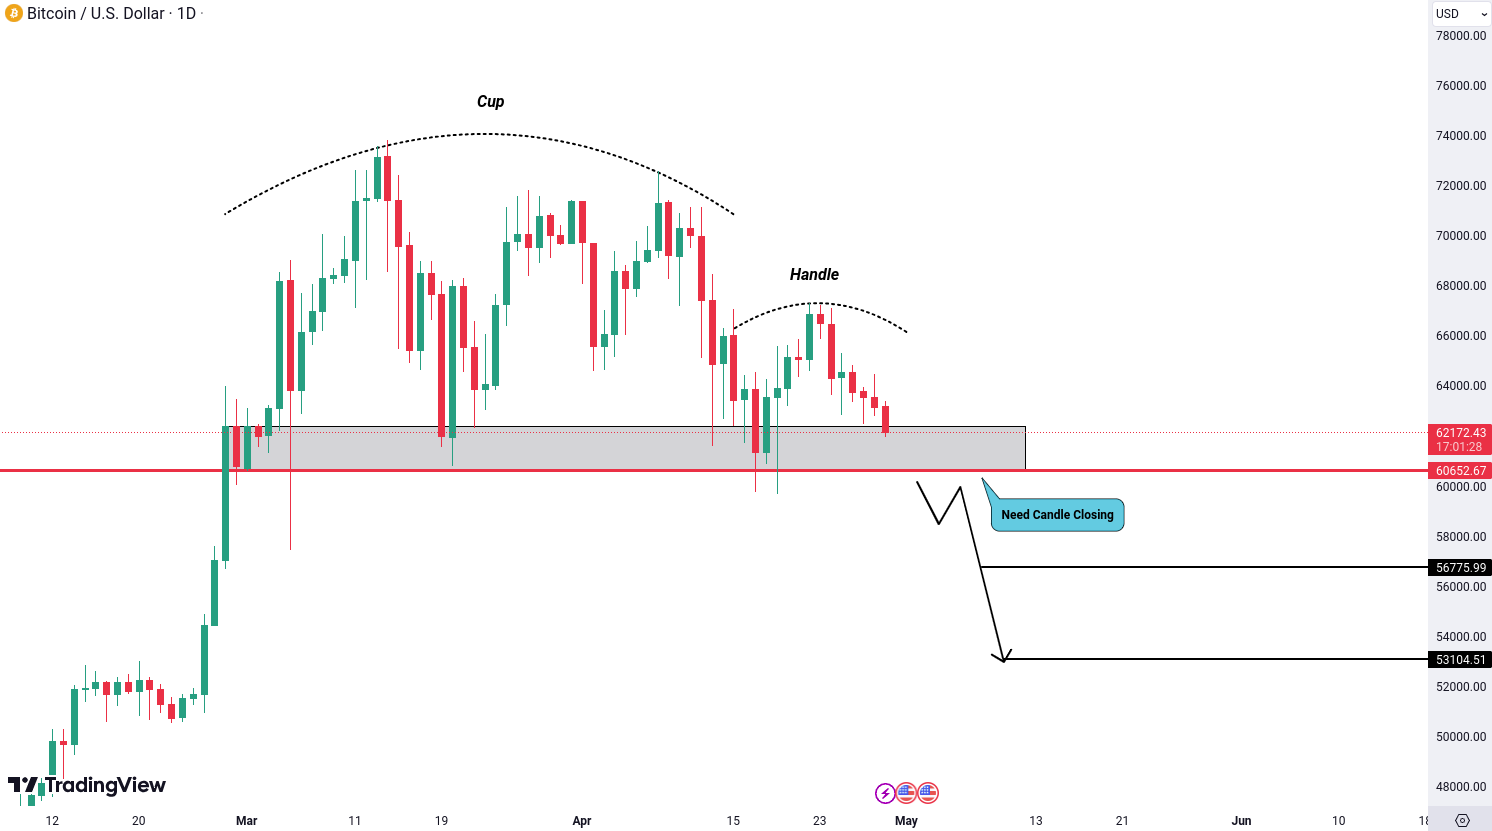
Bitcoin (BTC) Analysis
BTC has formed an inverse cup and handle pattern, increasing the likelihood of a bearish move. To confirm this bearish scenario, we’ll need to see a breakdown below the level of 60,652 USD, along with a candle closing below this level. If that happens, the price could continue its downward trend, with potential targets around 56,775 USD and 53,104 USD.
Ethereum (ETH) Analysis
ETH has developed a falling wedge pattern and an M pattern, both indicating a potential bearish trend. These patterns suggest a possible continuation of the current downtrend. For confirmation of this bearish scenario, we’ll need to see a breakdown below the level of 3035 USD. If this happens, it could lead to further downward movement, with potential targets around 2933 USD and 2812 USD.

MultiversX (EGLD) Analysis
EGLD is showing a head and shoulders pattern within a bearish trend which suggests a potential continuation of the current downtrend. This pattern increases the likelihood of further bearish movement. To confirm this scenario, we’ll be watching for a breakdown below the neckline and support level of 36.56 USD. If the price breaks below this level, it could signal more downward pressure, with potential targets around 34.60 USD and 32.96 USD.

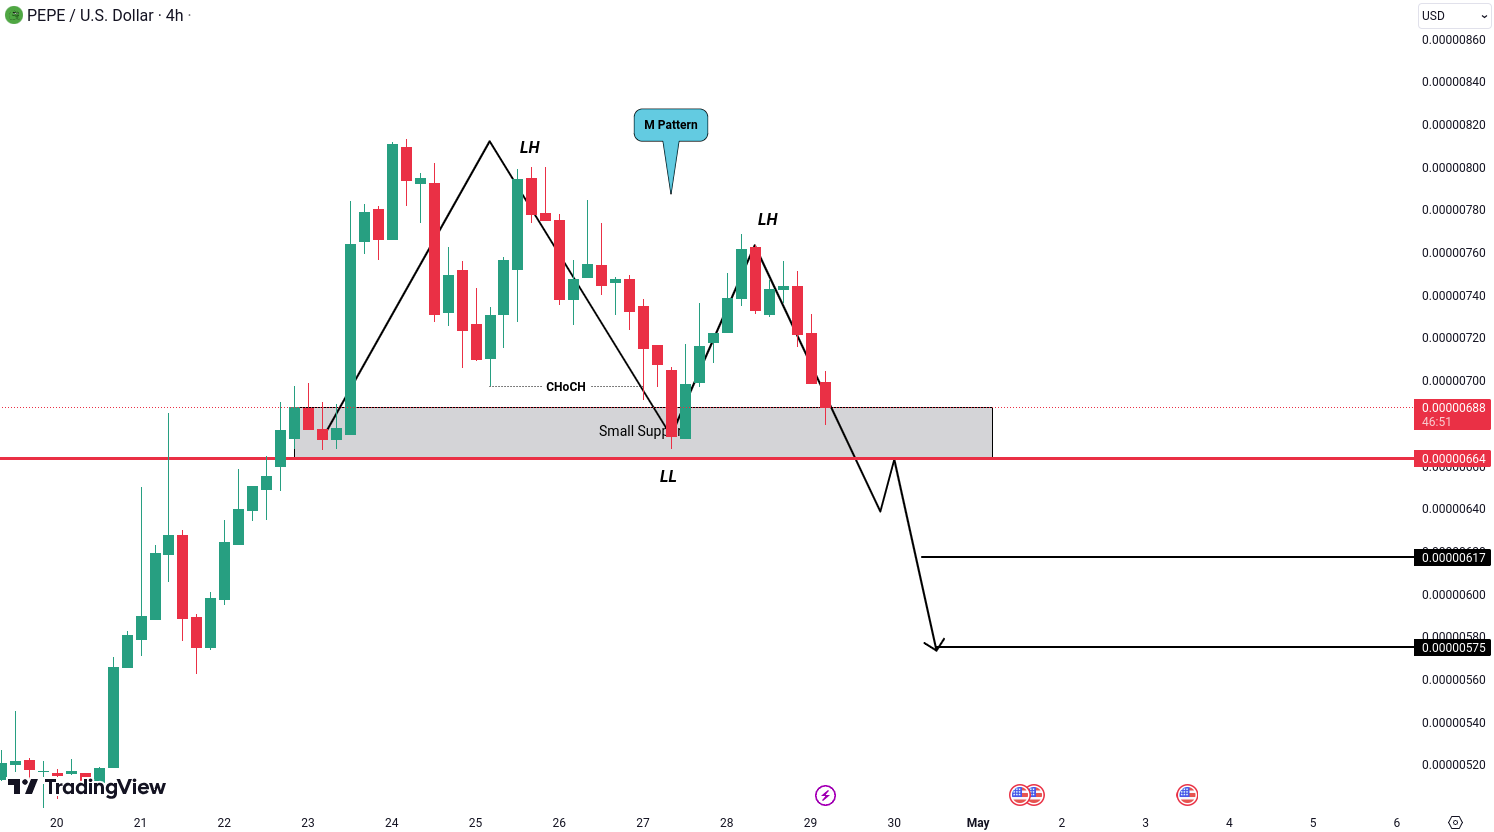
Pepe (PEPE) Analysis
For PEPE we are seeing an M pattern alongside a change of character (CHoCH) toward a bearish market structure. This suggests that the price may be forming lower highs and lower lows, indicating a downtrend. To confirm this scenario, we need to see the price break below the level of 0.00000664 USD. If that happens, we could see targets around 0.00000617 USD and 0.00000575 USD.
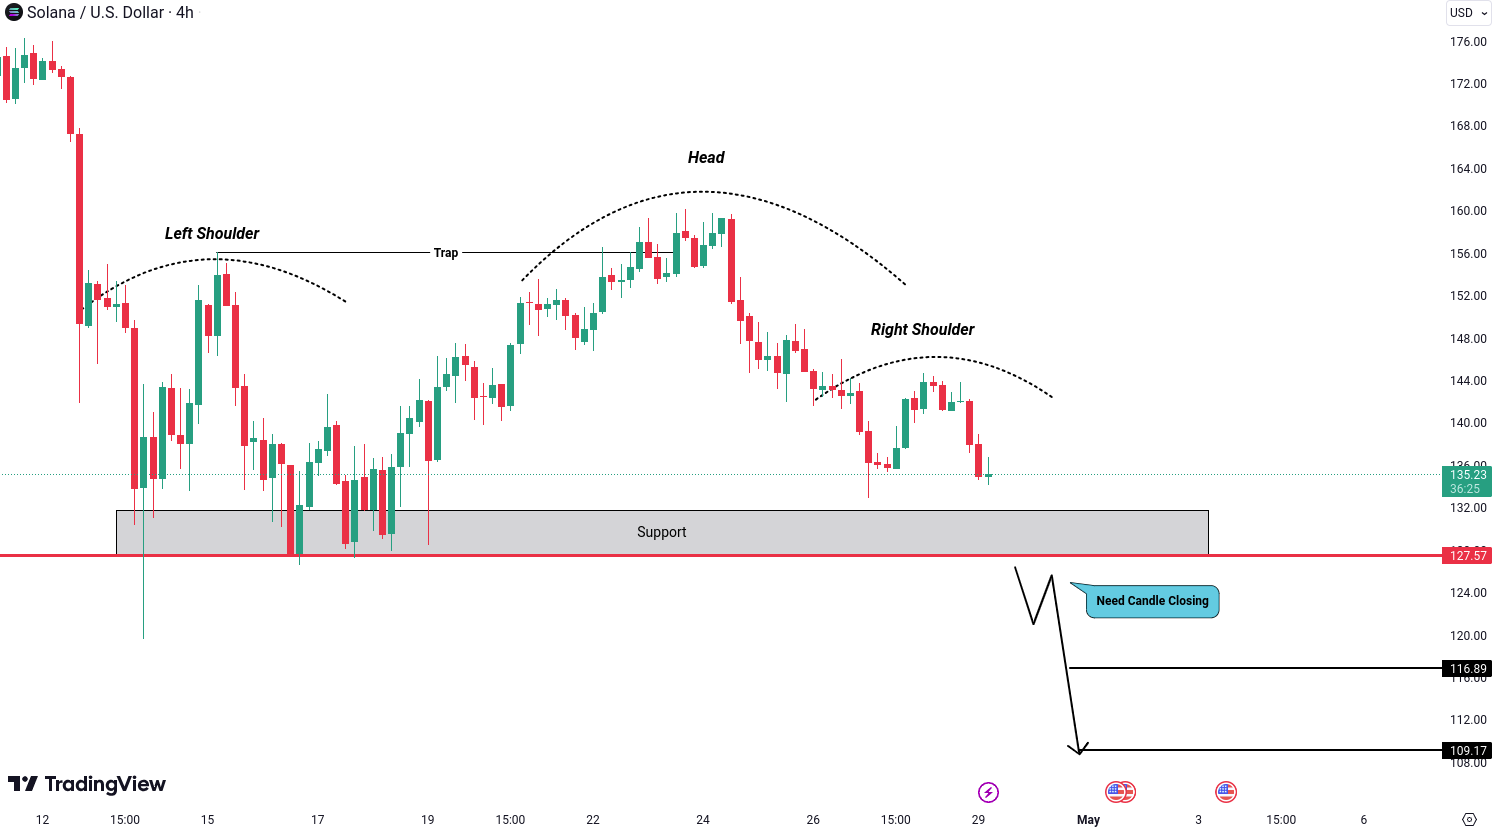
Solana (SOL) Analysis
SOL has formed a head and shoulders pattern, which typically indicates a potential bearish move ahead. If the price falls below the level of 127.57 USD, trapped traders may begin to sell their buy positions, adding further downward pressure. This scenario could lead to price targets around 116.89 USD and 109.17 USD.
All cryptocurrencies are available for trading on Tradesilvania , and their prices can be seen on the Tradesilvania price page, accessible through the following link: https://tradesilvania.com/en/prices
With the help of our platform, you can deposit, withdraw, buy or sell any of these cryptocurrencies using the free digital wallet. SEPA Top-up (On-Ramp & Off-Ramp) Euro and RON instant transfers and over 100 cryptocurrencies, are all available in our app.

Limitation of Liability
This report issued by Tradesilvania is purely informative and is not intended to be used as a tool for making investment decisions in crypto-assets. Any person who chooses to use this report in the process of making investment decisions assumes all related risks. Tradesilvania SRL has no legal or other obligation towards the person in question that would derive from the publication of this report publicly.
The content provided on the Tradesilvania website is for informational purposes only and should not be considered as investment advice, financial advice, trading advice, or any other form of advice. We do not endorse or recommend the buying, selling, or holding of any cryptocurrency. It is important that you conduct your own research and consult with a financial advisor before making any investment decisions. We cannot be held responsible for any investment choices made based on the information presented on our website.
The information in this report was obtained from public sources and is considered relevant and reliable within the limits of publicly available data. However, the value of the digital assets referred to in this report fluctuates over time, and past performance does not indicate future growth.
Total or partial reproduction of this report is permitted only by mentioning the source.