
Crypto Market update and BTC, ETH, EGLD, AAVE and MATIC analysis - 6 October 2023


Crypto Market in the last 24h:
🌐 Global cryptocurrency market: €1.03T (+0.05%)
💹 Total crypto volume in the last 24 hours: €24.5B (+7.62%)
🚀 DeFi volume: €2.33B (9.51% of the total volume)
💳 Stablecoins: €22.7B (92.66% of the total volume)
📊 Bitcoin dominance: 49.65% (-0.03%)
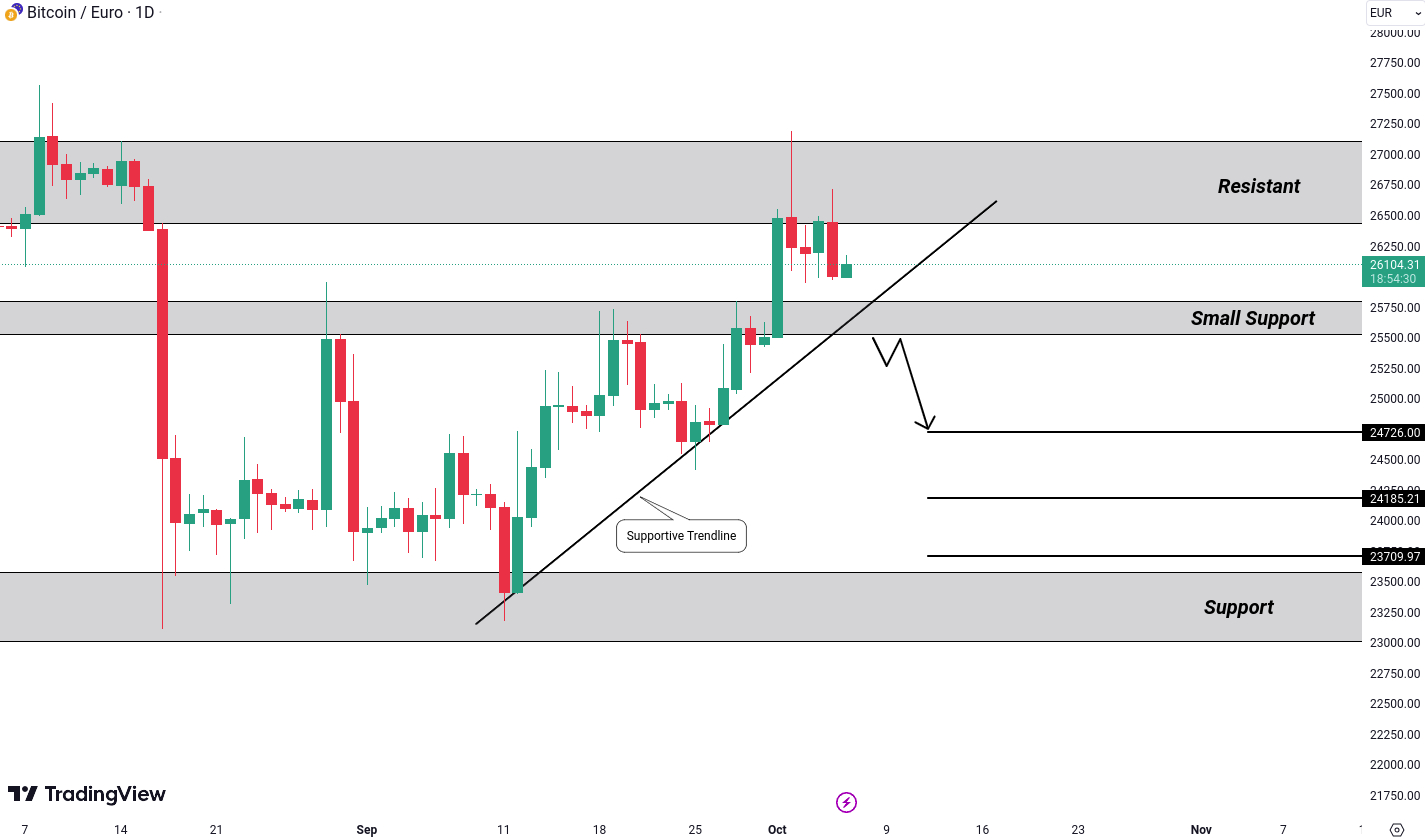
Bitcoin (BTC) Analysis
Bitcoin (BTC) is currently at a critical juncture, hovering around the significant resistance level of 26,739 Euro. Additionally, there’s a supporting trendline that has held the price up on two occasions.
The interesting part is, if the price encounters resistance here and manages to break below both the supportive trendline and the minor support level at 25,529 Euro, it might pave the way for a bearish movement. In such a scenario, we could potentially see the price dropping to levels around 24,726 Euro, 24,185 Euro, and 23,709 Euro.
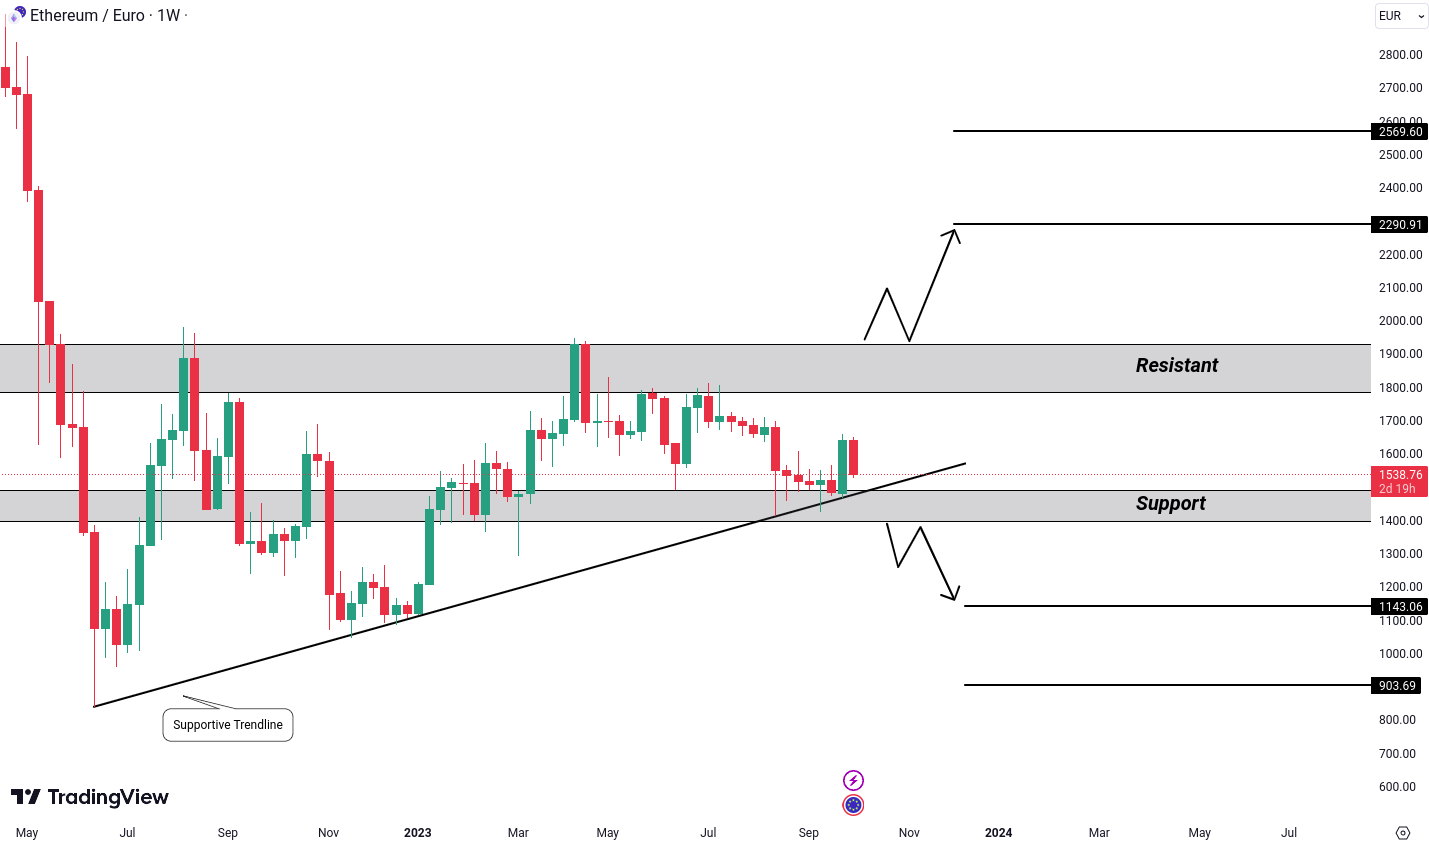
Ethereum (ETH) Analysis
Ethereum (ETH) is currently showing a pattern that resembles a triangle. It’s also interesting to note that the price is finding support from a trendline.
Now, here’s the crucial part: If the price breaks down below this supporting trendline and the level of 1,396 Euro, it could signal a bearish move with potential targets at 1,143 Euro and 903 Euro. This would be an essential development for traders to watch closely.
On the flip side, if the price manages to break out above the resistance level at 1,956 Euro, it might open the door for a move towards 2,290 Euro and even 2,569 Euro. Such a breakout could also be seen as an opportunity for long-term investment, so it’s a significant level to keep an eye on.
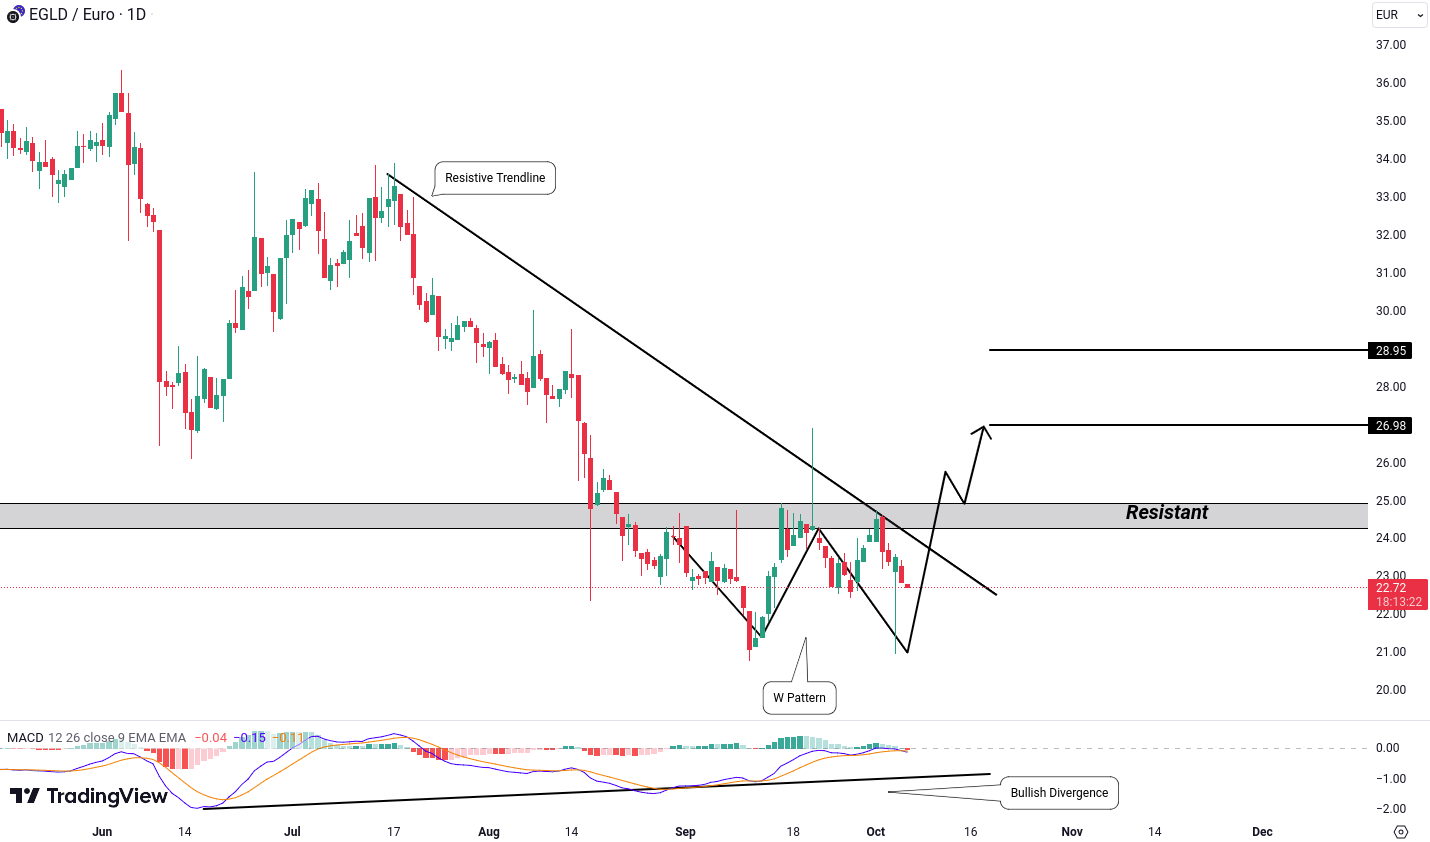
MultiversX (EGLD) Analysis
MultiversX (EGLD)'s daily chart is giving us some interesting signals. First off, we have a resistant trendline in play. Additionally, there’s a W pattern forming, which is typically considered a reversal pattern signalling a shift from a bearish to a bullish trend.
Adding to the bullish case, the MACD indicator is showing bullish divergence. This divergence occurs when the price forms lower lows but the MACD forms higher lows, suggesting potential upward momentum.
However, for full confirmation of this bullish outlook, we’re looking for a breakout above the resistance level at 25.10 Euro. If this breakout occurs, it could open the door to targets at 26.98 Euro and 28.95 Euro. So keep a close watch on that resistance level for trading opportunities.
Aave (AAVE) Analysis
Aave (AAVE) is currently showing us a falling wedge pattern. This pattern typically indicates a bullish reversal but there’s a catch. The price is hovering near the upper trendline of this wedge which could act as resistance.
To confirm the potential bearish move we’re looking for a breakdown below a small support zone at 57.56 Euro. This breakdown could open the door to targets at 51.13 Euro and 45.91 Euro.

Polygon (MATIC) Analysis
Polygon (MATIC) is displaying a promising setup on its chart. We can spot a W pattern along with bullish divergence in the MACD indicator. This combination often signals potential for a bullish upturn.
To confirm this bullish sentiment we’re closely watching the resistance level at 0.5697 Euro. If the price convincingly breaks above this level and closes a daily candle above it it could be strong indicator of bullish trend. In such scenario we can set our sights on targets around 0.6082 Euro and 0.6456 Euro.

Did you like our analysis? Want to learn more or have a different perspective?
Let's discuss it in the Tradesilvania community 👉 Telegram Group
All cryptocurrencies are available for trading on Tradesilvania , and their prices can be seen on the Tradesilvania price page, accessible through the following link: https://tradesilvania.com/en/prices
With the help of our platform, you can deposit, withdraw, buy, or sell any of these cryptocurrencies using the free digital wallet.
SEPA Top-up (On-Ramp & Off-Ramp) Euro and RON instant transfers and over 90 cryptocurrencies, are all available trought our app.