Crypto Market update and BTC, ETH, EGLD, ALGO and APE analysis


Crypto market in the last 24h:
Global crypto market cap: €981.89B, -1.34% in the last day. 📉
Total crypto market volume in the last 24 hours: €23.03B, +65.47%. 🚀
Total DeFi volume: €1.94B, 8.41% of the total crypto market 24-hour volume. 💼
Volume of all stablecoins: €21.38B, 92.84% of the total crypto market 24-hour volume. 💱
Bitcoin's dominance: 48.94%, -0.21% in the current day. ₿
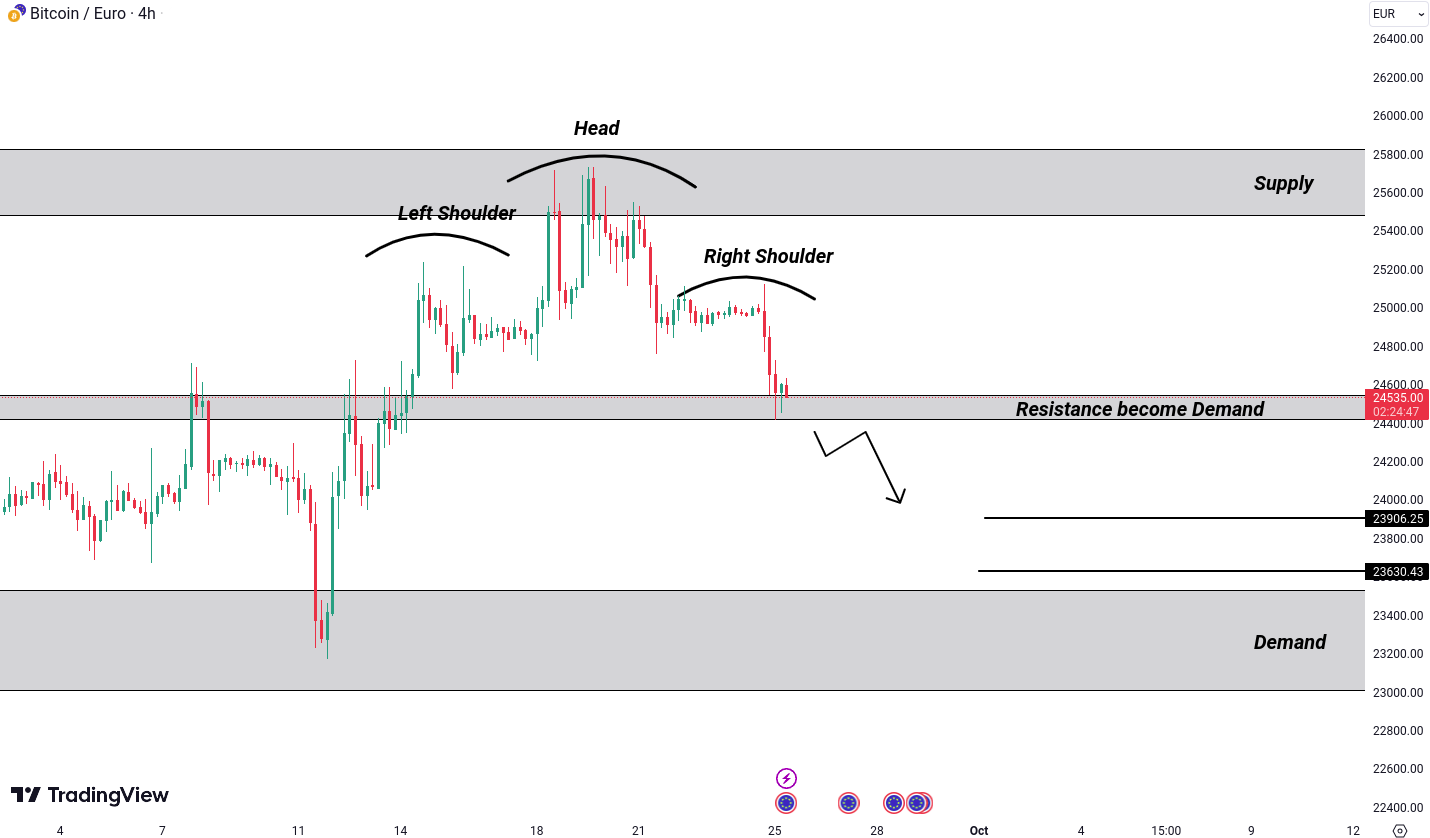
Euro (EUR) to Bitcoin (BTC) Analysis:
Taking a closer look at the 4-hour chart of BTC/EUR, an intriguing pattern is emerging - a head and shoulders pattern, often considered a potential indicator of a bearish trend reversal. What makes this setup more significant is its proximity to a key resistance level. When such a pattern aligns with a significant resistance area, it raises the likelihood of a bearish move.
The critical point to watch is whether the price can break below the demand area at 24,405 EUR. This zone has a history of switching between resistance and support. If it transitions back to being a resistance zone, we may expect bearish targets around 23,906 EUR and 23,630 EUR.
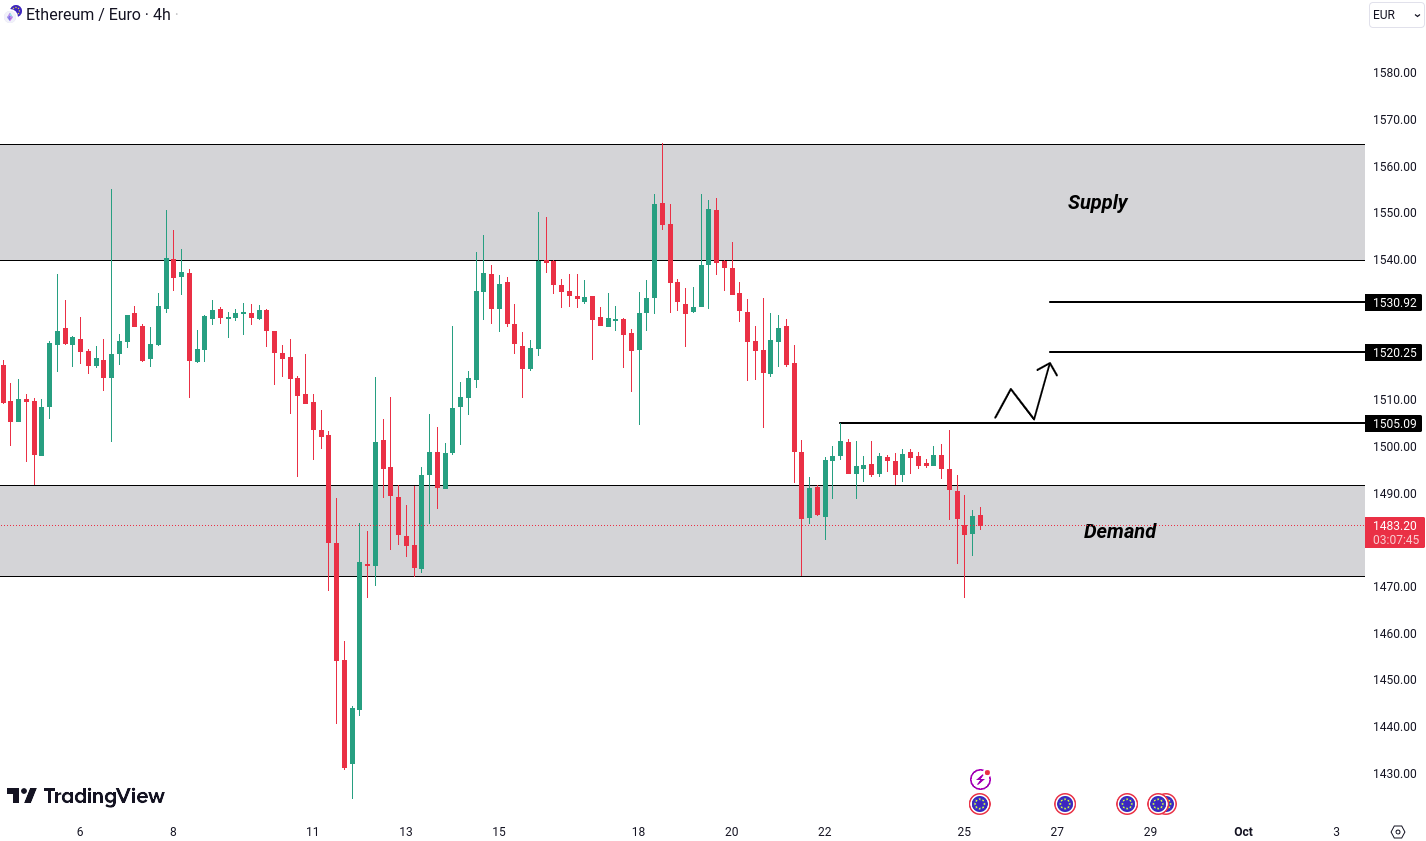
Ethereum (ETH) to Euro (EUR) Analysis:
Turning our attention to the ETH/EUR chart, it's currently in a consolidation phase near a significant demand area. What's intriguing here is the potential for a bullish move. A break above the previous lower high at 1505 EUR could signal the start of an upward trend. This shift from lower highs to higher highs is a positive sign for the bulls and might resemble the formation of a W pattern, a classic chart pattern often associated with trend reversals.
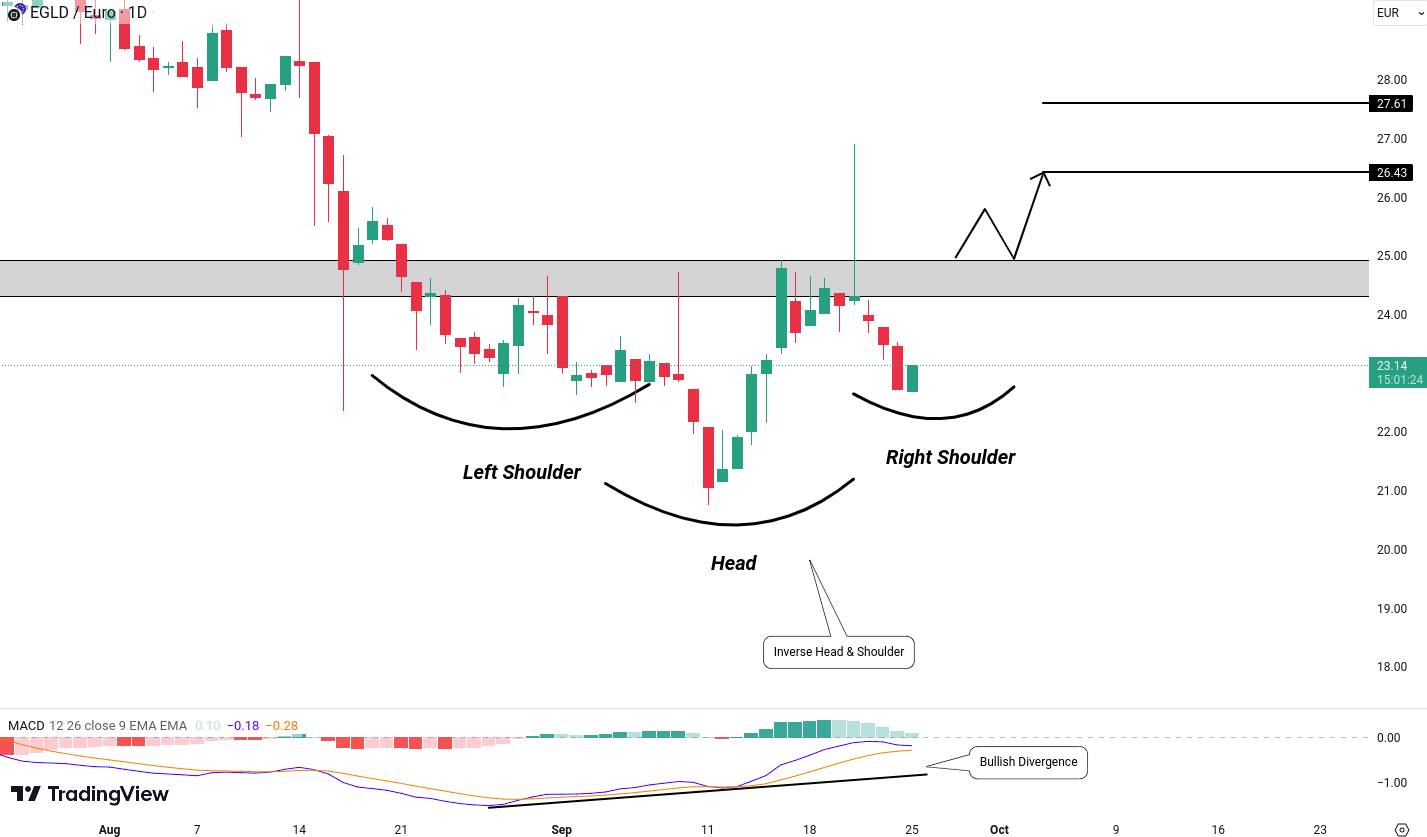
EGLD to Euro (EUR) Analysis:
Now, onto EGLD/EUR, something intriguing is happening on its daily chart. There's the formation of an inverse head and shoulder pattern, combined with bullish divergence in the MACD indicator. These are strong signals pointing to a potential bullish move. If the price breaks above the neckline and the resistance level at 25.08 EUR, it could mark the beginning of an upward trend. Traders may target levels around 26.43 EUR and 27.61 EUR if the bulls continue to dominate.
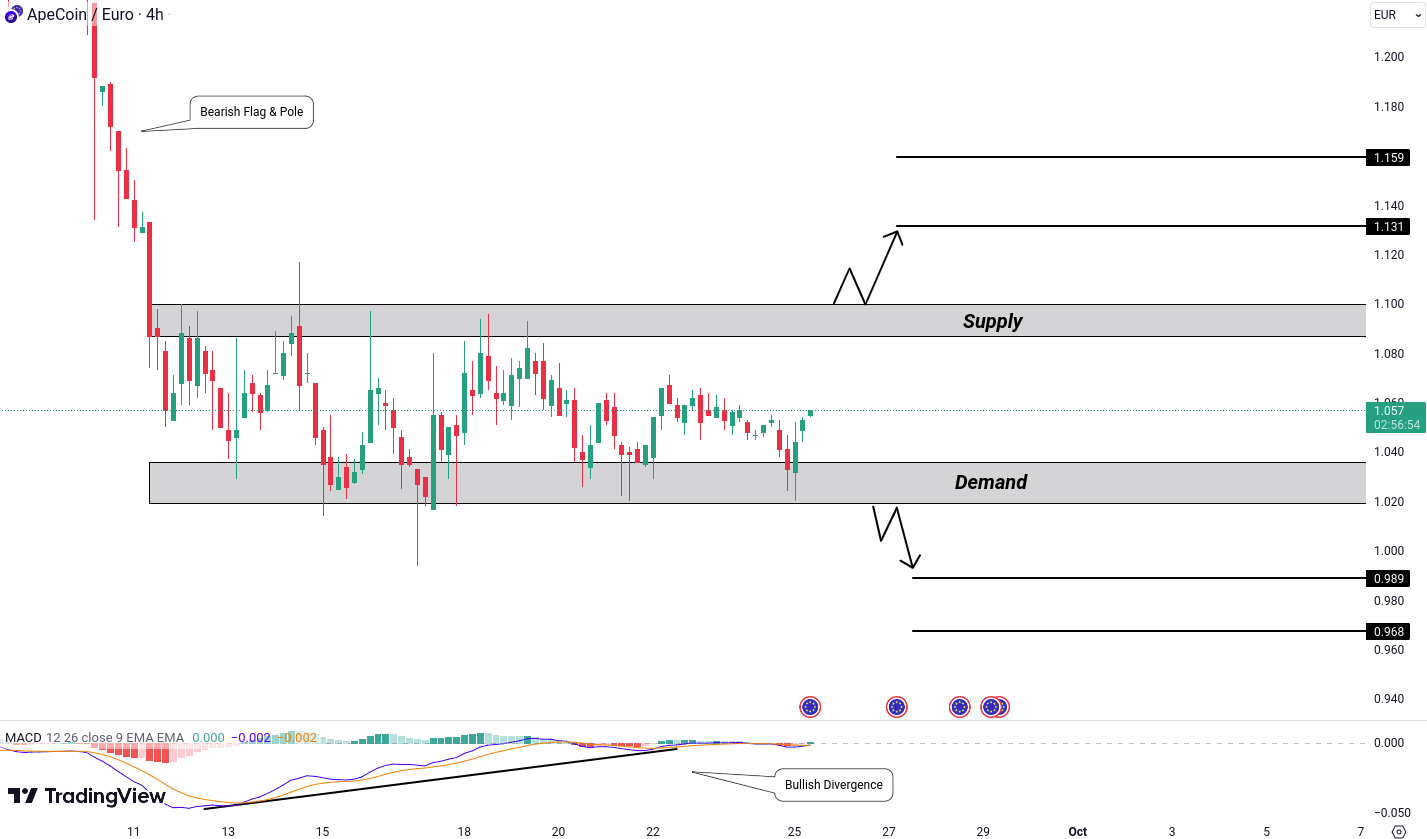
APE to Euro (EUR) Analysis:
Examining APE/EUR, we find an interesting pattern on its daily chart: the formation of a bearish flag and pole, with the price consolidating near a significant demand area. In these uncertain market conditions, focus on anticipating potential breakouts or breakdowns at key supply and demand zones. Two scenarios to consider:
- Breakdown Scenario: A successful breach of the demand area at 1.019 EUR could signal a bearish trend's onset, with potential targets around 0.989 EUR and 0.968 EUR.
- Breakout Scenario: If the price surges above the supply area at 1.103 EUR, it may indicate an upward trajectory. In this case, traders could set their sights on targets at approximately 1.131 EUR and 1.159 EUR. Note the presence of bullish divergence in the MACD, adding complexity to the analysis.
Stay vigilant regarding these key price levels, as they could present critical points for potential trading opportunities in APE/EUR.
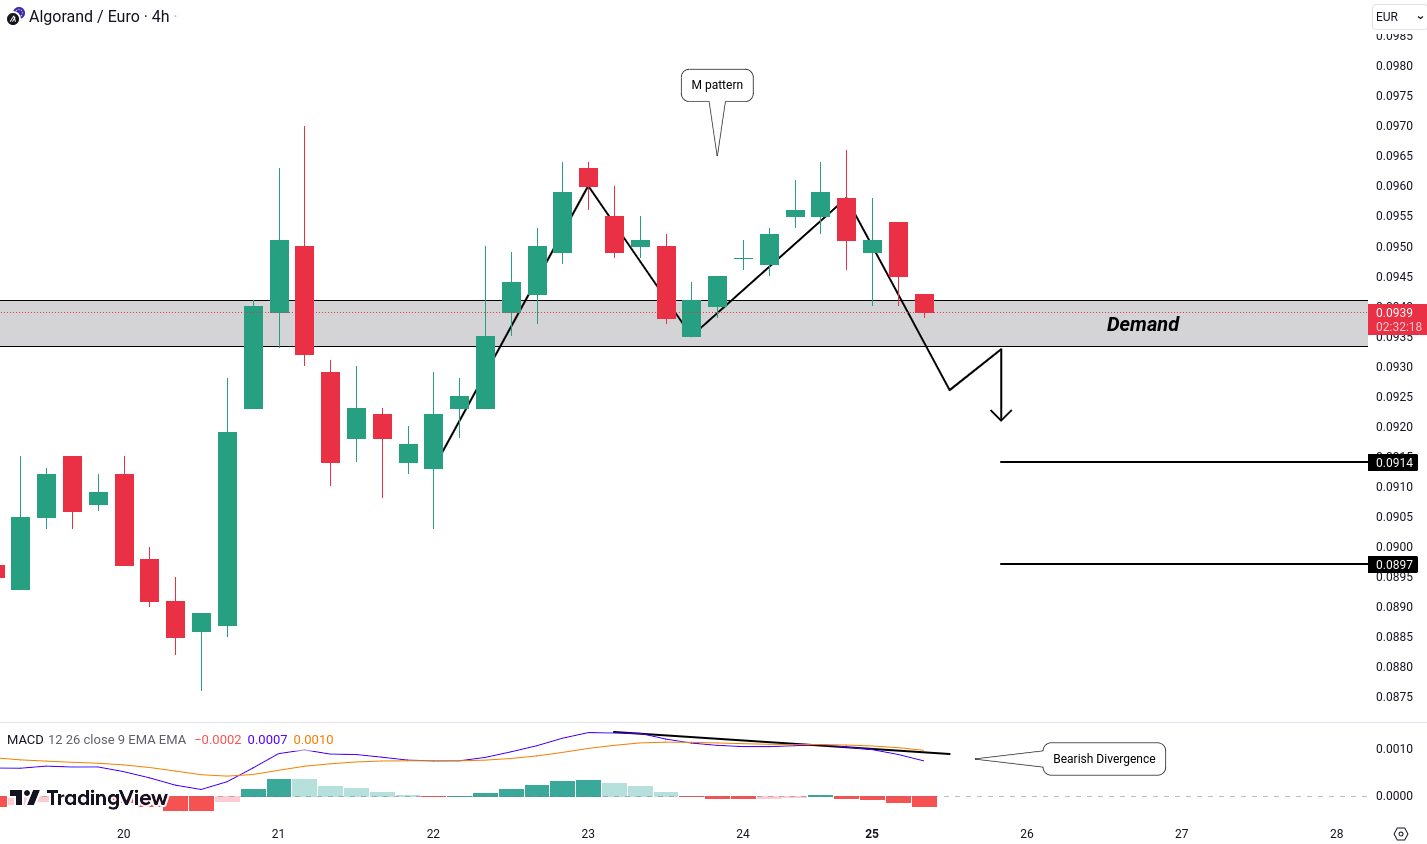
ALGO to Euro (EUR) Analysis:
ALGO/EUR is forming an intriguing pattern on the 4-hour timeframe: an M pattern with bearish divergence detected on the MACD indicator.
The M Pattern: Typically seen as a bearish signal, it suggests a possible reversal of the prevailing bullish trend, indicating a sentiment shift.
Bearish Divergence: When the price forms higher highs while the MACD displays lower highs, it can serve as a warning sign of a potential downward move.
Given these technical signals, it's wise to consider the bearish scenario for ALGO/EUR:
Breakdown Scenario: If the price successfully breaches the demand level at 0.0933 EUR, it may open the path for further downside movement. In such a case, traders might target levels around 0.0914 EUR and 0.0897 EUR.