Crypto Market update and BTC, ETH, EGLD, LTC and SHIB analysis - 28 September 2023


Crypto market in the last 24h:
🌐 Global MarketCap: 1 trillion euros (+0.14%)
💰 Total 24h Volume: 26.75 billion euros (+34.38%)
📈 DeFi 24h Volume: 2.61 billion euros (9.75%) 💼
Stablecoins Volume: 25.06 billion euros (93.71%)
🌕 Bitcoin Dominance: 48.84% (-0.07%)
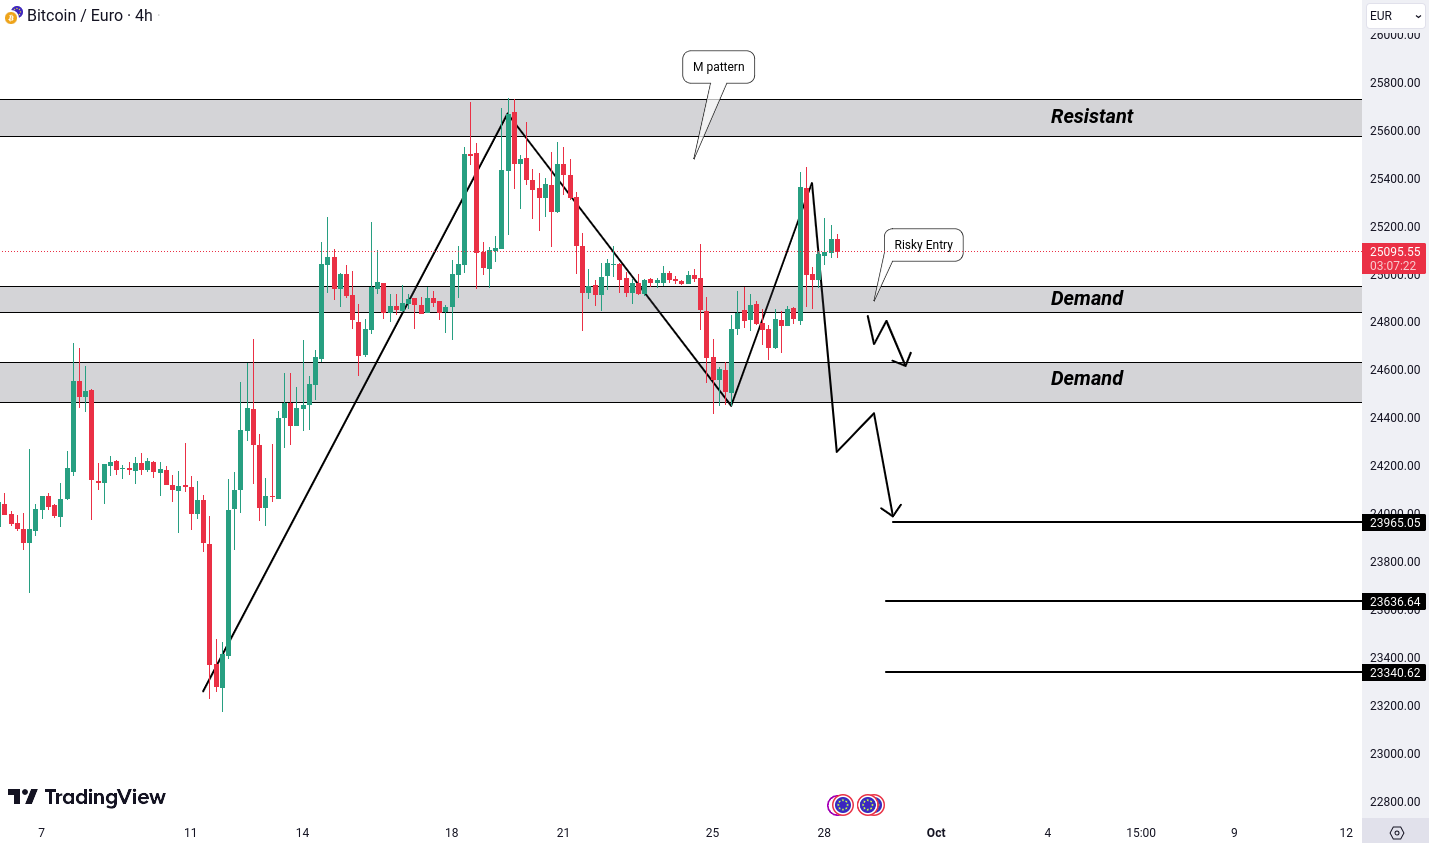
Bitcoin (BTC): M Pattern
Let's take a fresh look at BTC/EUR and the current scenario on its 4-hour chart. Previously, we discussed the possibility of a breakdown, but as the market evolves, we now observe the formation of a bearish M pattern near a resistance area.
The Bearish M Pattern: This pattern is named after its resemblance to the letter 'M' and often signifies a potential reversal from a bullish trend to a bearish one. What's interesting about it is that the right top of this 'M' is lower than the left top, indicating strong bearish pressure.
For confirmation of this bearish scenario, we need to see a breakdown below the demand level of 24,432. If this level is breached, potential downside targets to watch for are 23965, 23636, and 23340. It's worth noting that there's a risky entry zone below the demand level of 24,820, suitable primarily for professional traders experienced in risk management.
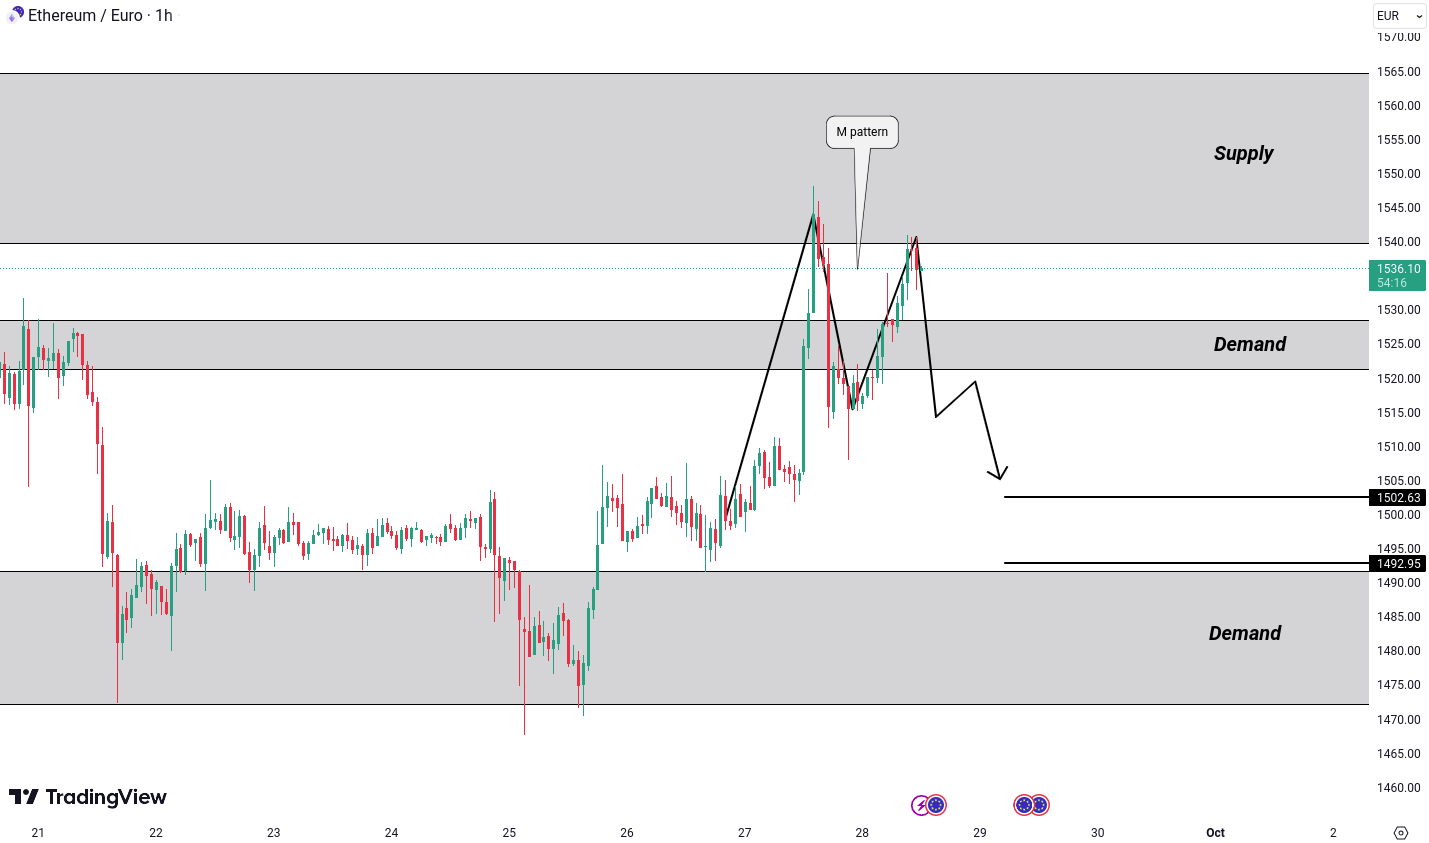
Ethereum (ETH): Forming a Bearish M Pattern
ETH/EUR recently hit our previous bullish targets from the demand area. However, it is now near a supply zone and forming a bearish "M" pattern on the hourly timeframe. A breakdown below 1,519 could lead to potential targets at 1,502 and 1,492.
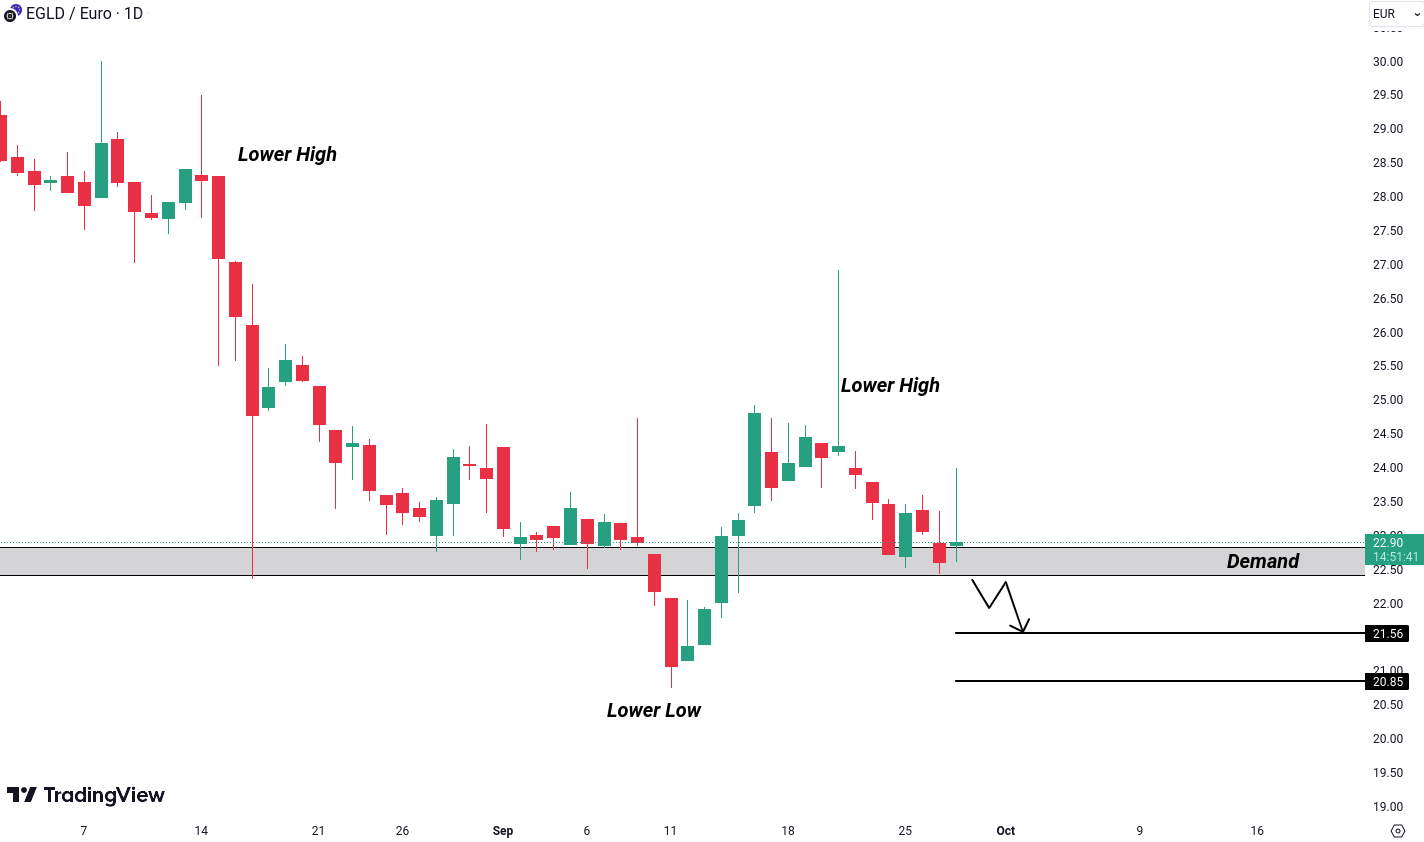
MultiversX (EGLD): Lower Highs and Lower Lows, Consolidation
EGLD/EUR is currently following a pattern of lower highs and lower lows. It's consolidating near the demand level on the daily timeframe. If EGLD breaks down below 22.34, we could expect the next lower low, with potential targets around 21.56 and 20.85.
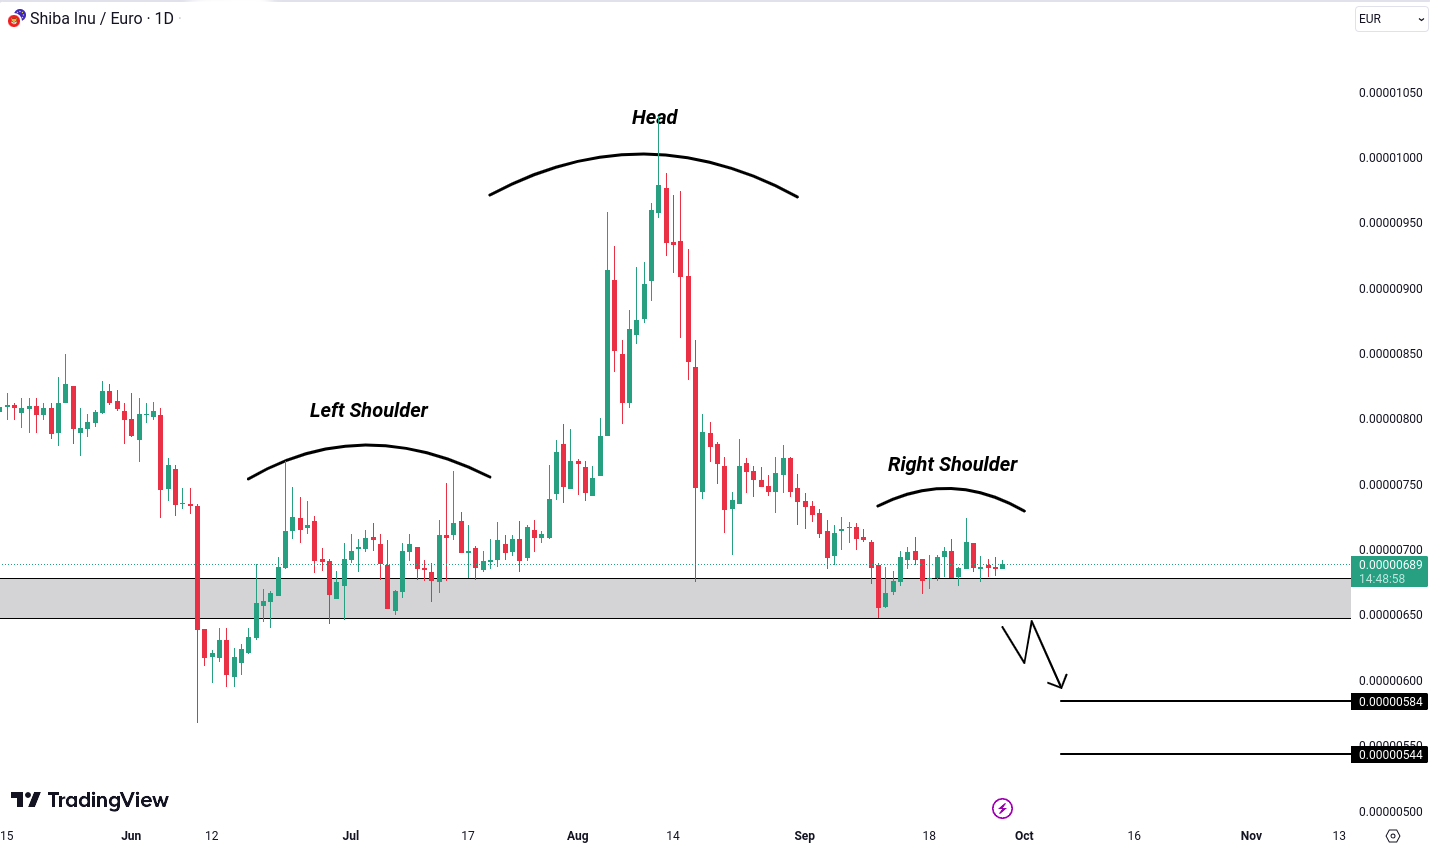
Shiba Inu (SHIB): Head and Shoulders Pattern
SHIB/EUR is forming a head and shoulders pattern on the daily timeframe. If it breaks down below the level of 0.00000645, potential targets to consider are 0.00000584 and 0.00000544. This trade's effectiveness could be enhanced if Bitcoin (BTC) shows bearish movement, as Bitcoin often influences the broader cryptocurrency market.
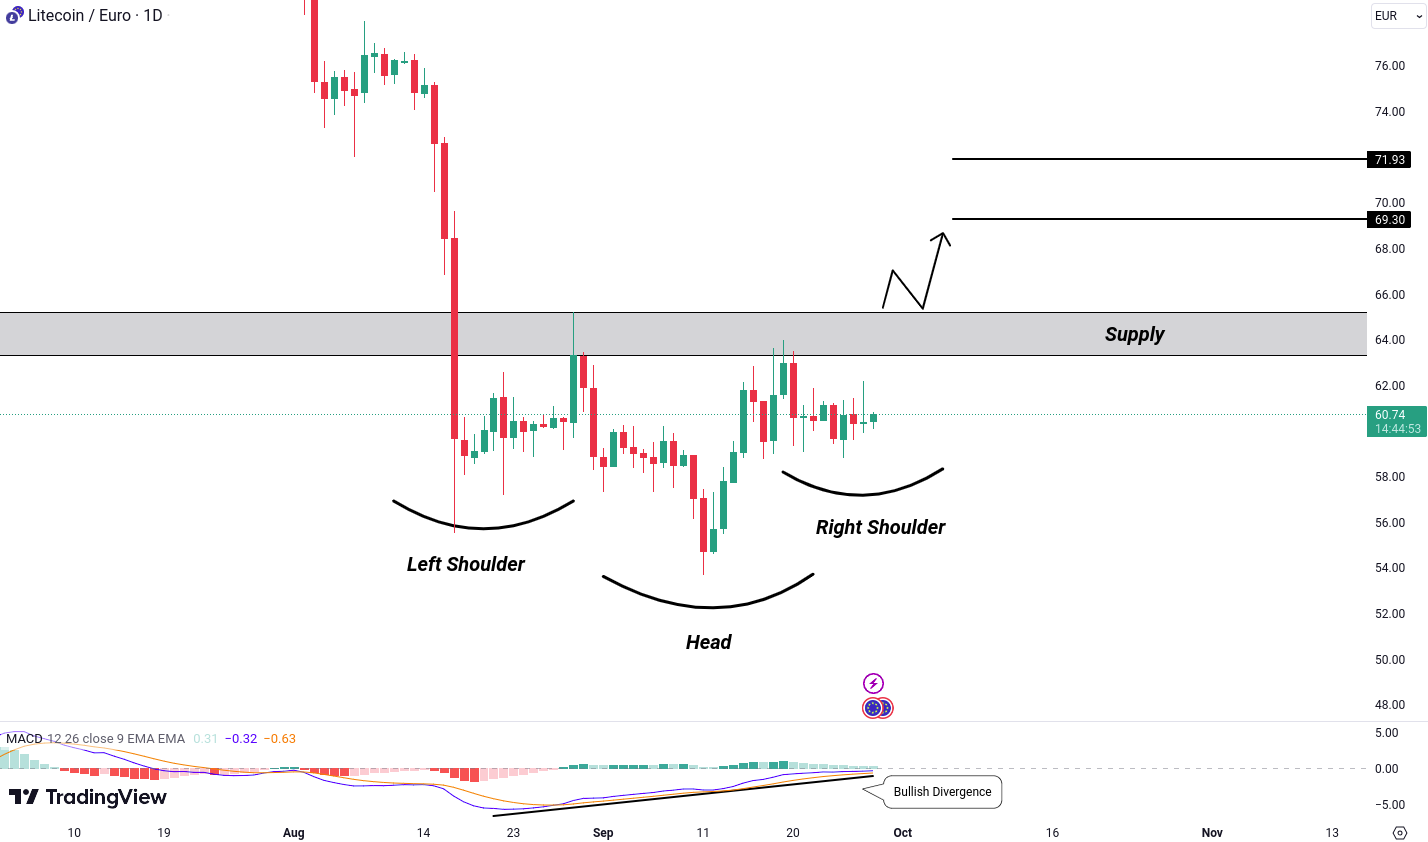
Litecoin (LTC): Inverse Head and Shoulders Pattern With Bullish Divergence
LTC/EUR is forming an inverse head and shoulders pattern with bullish divergence on the daily timeframe. If Bitcoin (BTC) becomes bullish and LTC breaks out above the neckline and the demand level of 65.49, potential targets could be 69.30 and 71.93.