Crypto this week - 11 August 2023

Global market 🌍 in the last 24h
💰 Market Cap: €1.07T (-0.60% ⬇️)
📊 Total Volume: €21.64B (-19.32% ⬇️)
💱 DeFi Volume: €1.9B (8.80% of 24hr volume)
💲 Stable Coins: €20.44B (94.49% of 24hr volume)
📈 Bitcoin Dominance: 48.79% (-0.01% ⬇️)
Bitcoin (BTC) analysis and update
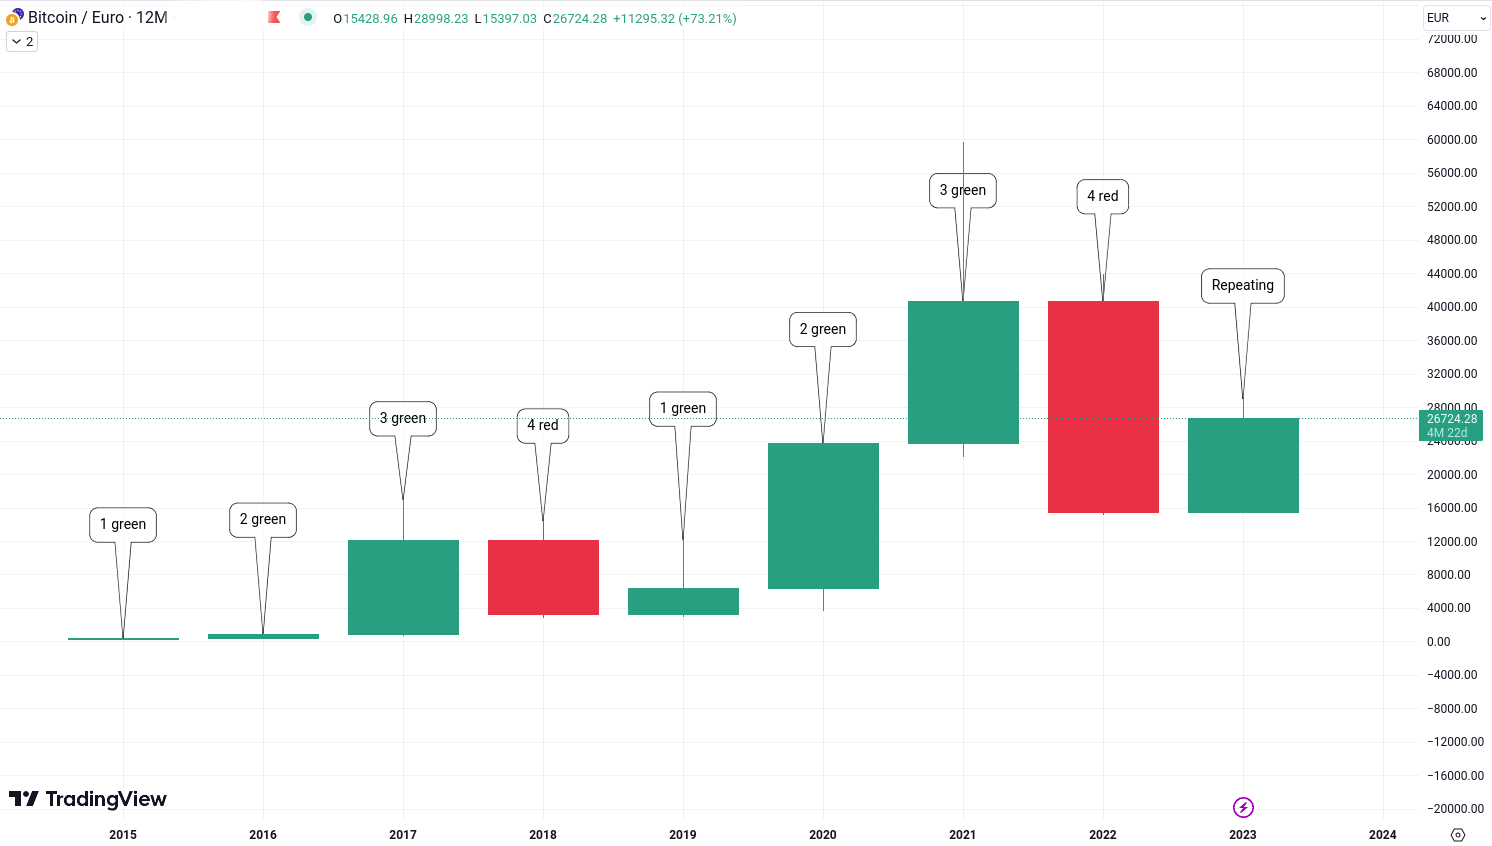
12-Month Candlestick Evaluation: Upon scrutinising the 12-month candlestick chart of BTC/EUR, an intriguing recurrent pattern emerges. A sequence of three bullish candles is succeeded by a sole bearish candle, and this cyclic sequence has manifested itself twice within the specified time frame. Notably, Bitcoin is presently in the process of formulating another bullish candle. This recurring pattern insinuates the potential emergence of a sustained bullish trajectory over the long haul.
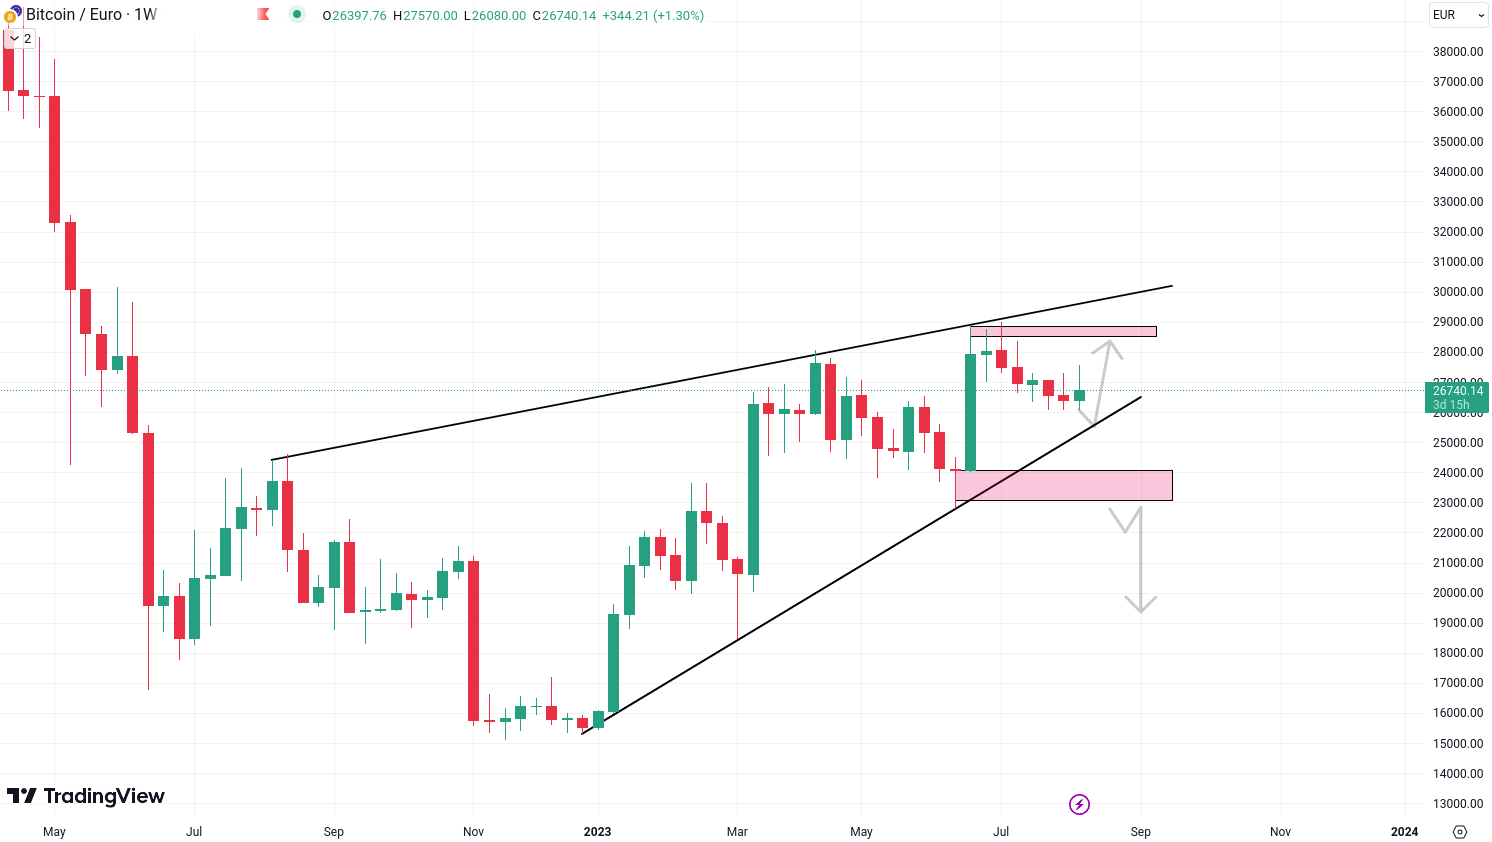
Weekly Time Frame - In our weekly examination of BTC/EUR, we're presented with a compelling ascending wedge pattern that demands attention. Seasoned investors should closely monitor the reinforcing trendline, as it may signal a bullish surge aiming for the previous peak. On the flip side, a breach could steer the price into a lateral market movement. It's crucial to keep a keen eye on the noteworthy bearish pivot point at 22,800 Euro. It's worth noting that leveraging a BTC sell-off can provide opportunities for both short-term trading maneuvers and the implementation of long-term investment strategies.
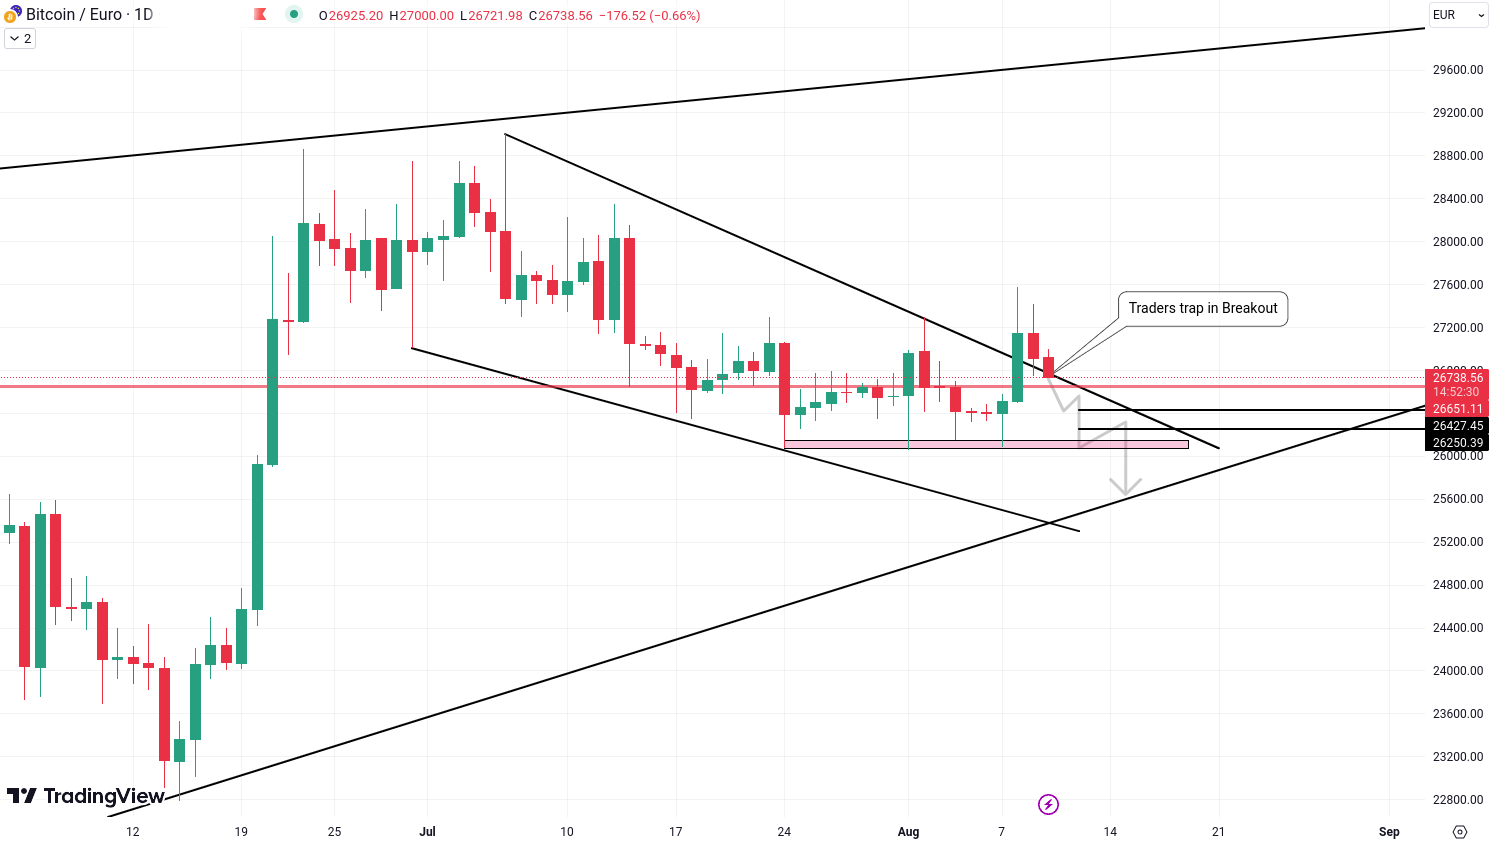
Daily Time Fram - In our daily assessment of BTC/EUR, we've identified a descending wedge pattern that appears to be on the verge of a breakout failure. The current scenario is presenting signs of waning breakout momentum. This development could trigger a domino effect, impacting traders who took positions based on the breakout strategy. Such circumstances could potentially lead to a surge in selling due to stop-loss orders being triggered.
The pivotal level to closely monitor stands at 26,738 Euro, as a breakdown below this point could serve as an indicator of a potential decline towards 26,427 Euro and 26,250 Euro.
Ethereum (ETH) analysis and update
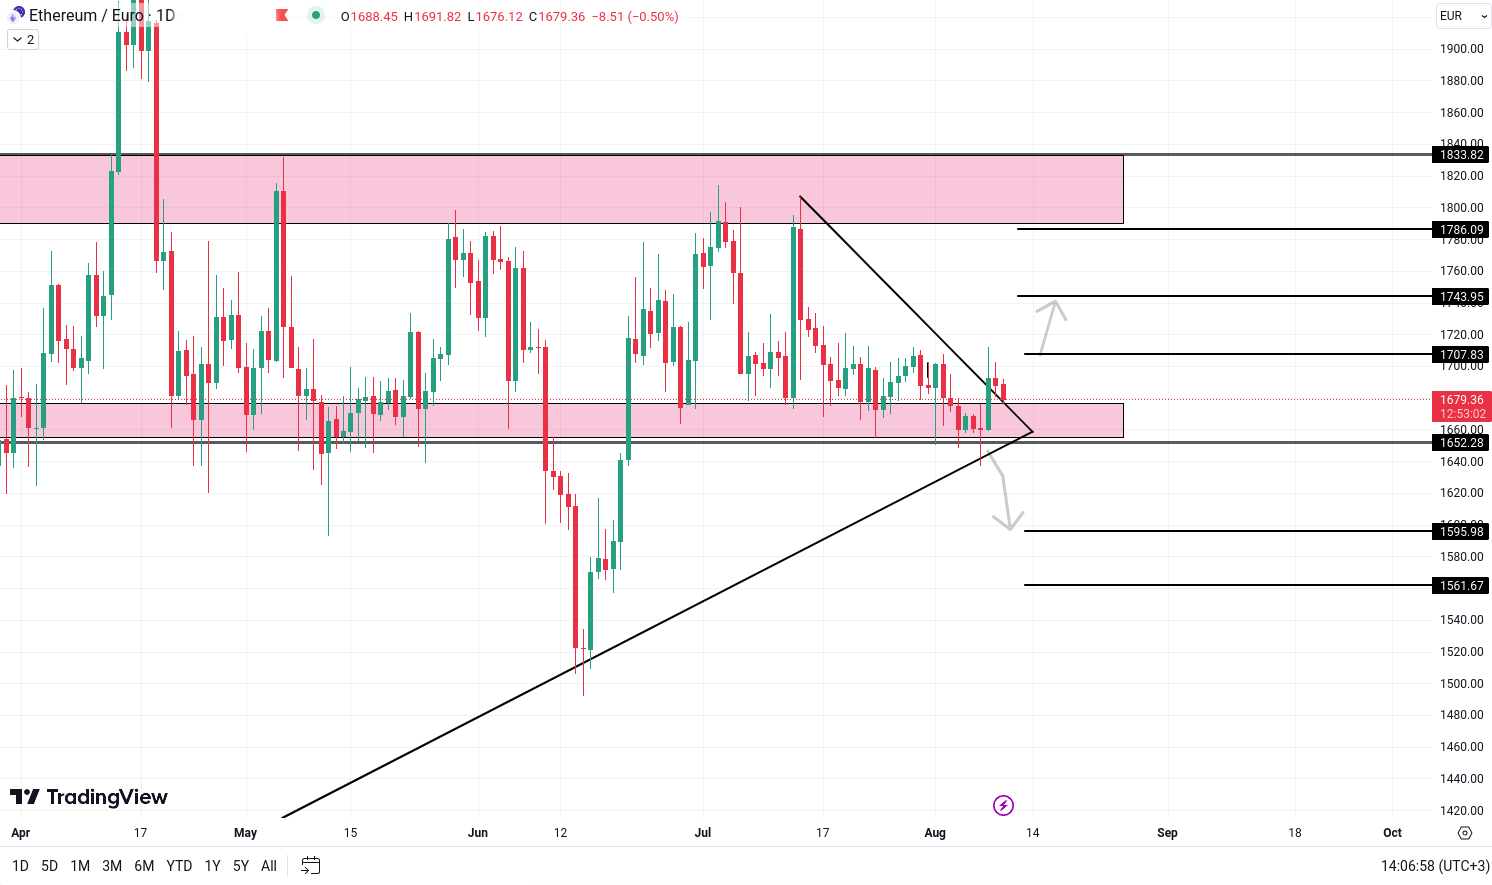
As observed, ETH/EUR has demonstrated remarkable consistency, aligning with our previous analysis. The pivotal breakout level at 1,707 Euro and the critical breakdown level at 1,652 Euro have both demonstrated robust resilience. This dynamic has given rise to a compelling chart pattern that's capturing the attention of astute traders: the triangle pattern.
Continuing our analytical journey, let's delve into the potential outcomes. Should the price successfully breach the 1,707 Euro mark, it could signal a bullish upsurge, potentially propelling it towards 1,743 Euro and 1,786 Euro . Conversely, should it descend below the support level at 1,652 Euro , a bearish scenario might unfold, with projected downside targets at 1,596 Euro and 1,561 Euro .
MultiversX (EGLD) analysis and update
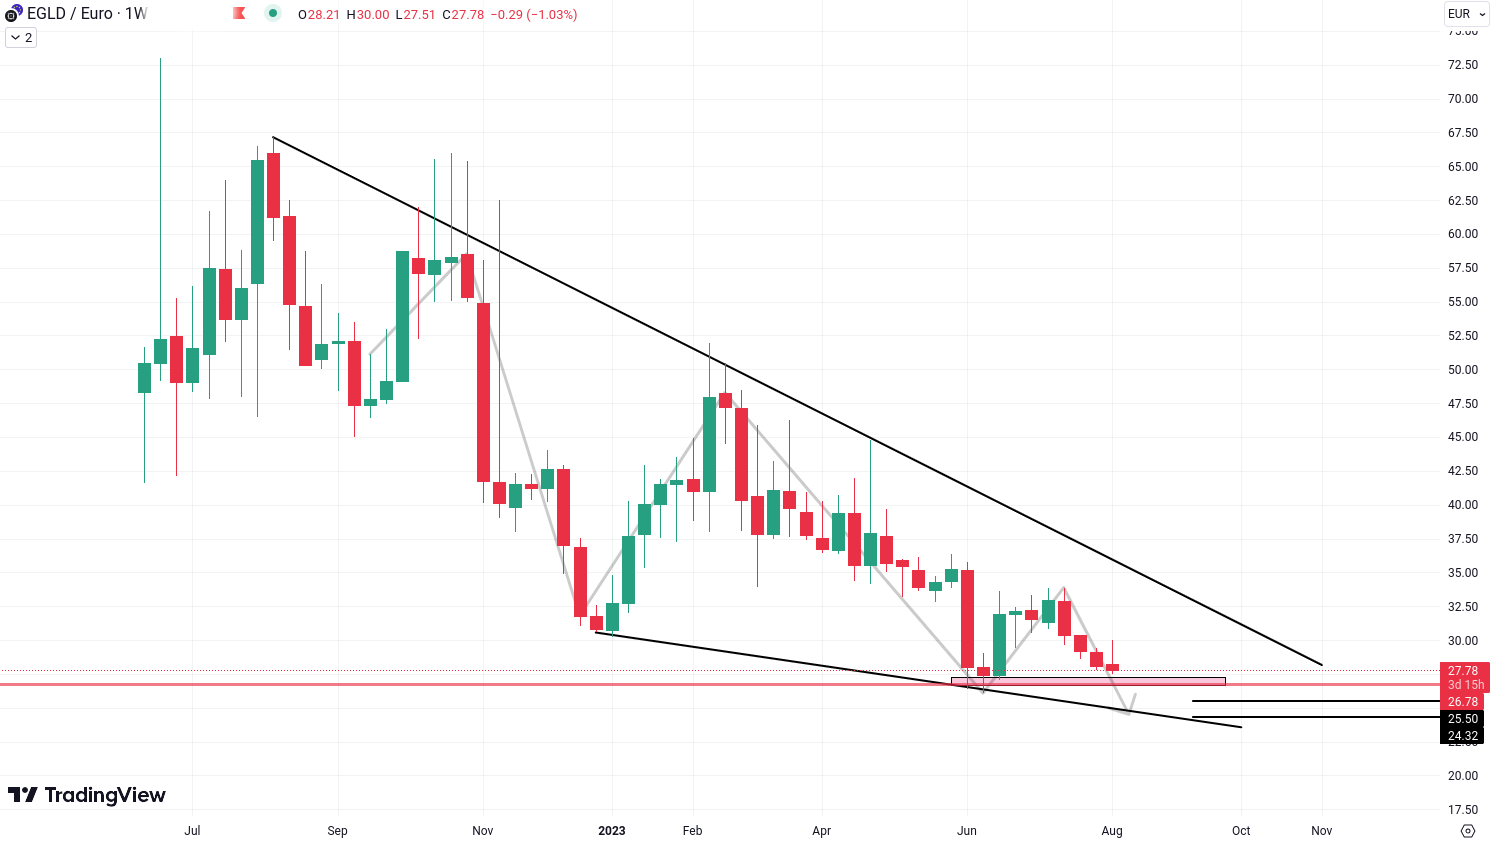
Examining the price dynamics, it becomes evident that EGLD/EUR is adhering to a pattern of forming lower lows. This pattern implies the likelihood of a forthcoming downward shift in the price trajectory. As the price steadily approaches the previous low mark of 27.77, it becomes imperative to maintain a vigilant watch on the unfolding scenario to ascertain potential outcomes.
Should a breakdown transpire below the critical support level of 27.77 Euro, traders might strategically target possible levels around 25.50 Euro and 24.32 Euro. These levels hold the potential to function as substantial support zones, exerting an influence on the price's trajectory and potentially steering its course in the short term.
Ripple (XRP) analysis and update
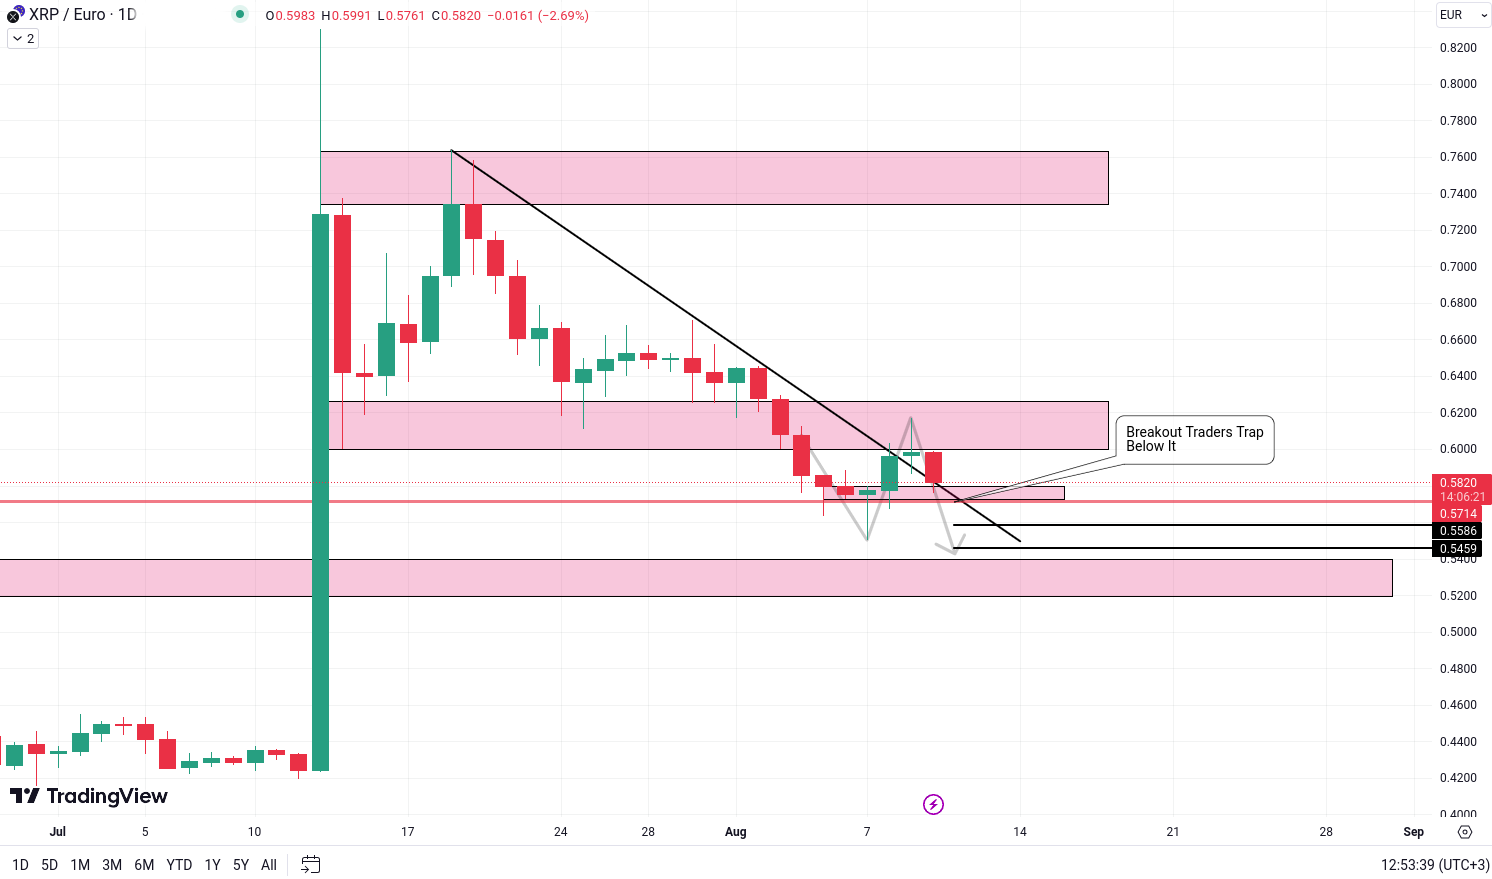
Similar to BTC, XRP/EUR underwent a breakout above a trendline. However, recent price action has indicated a reversal, with XRP/EUR retracing beneath the breakout trendline. This prompts significant inquiries regarding prospective outcomes in the days ahead.
As XRP/EUR continues its descent beneath the trendline and subsequently breaches the 0.5714 Euro level, a breakdown scenario might be unfolding. This scenario's evolution could be influenced by factors such as stop loss triggering and prevailing market dynamics.
In the event of a breakdown, traders could anticipate potential targets around 0.5586 Euro and 0.5459 Euro.
EOS (EOS) analysis and update
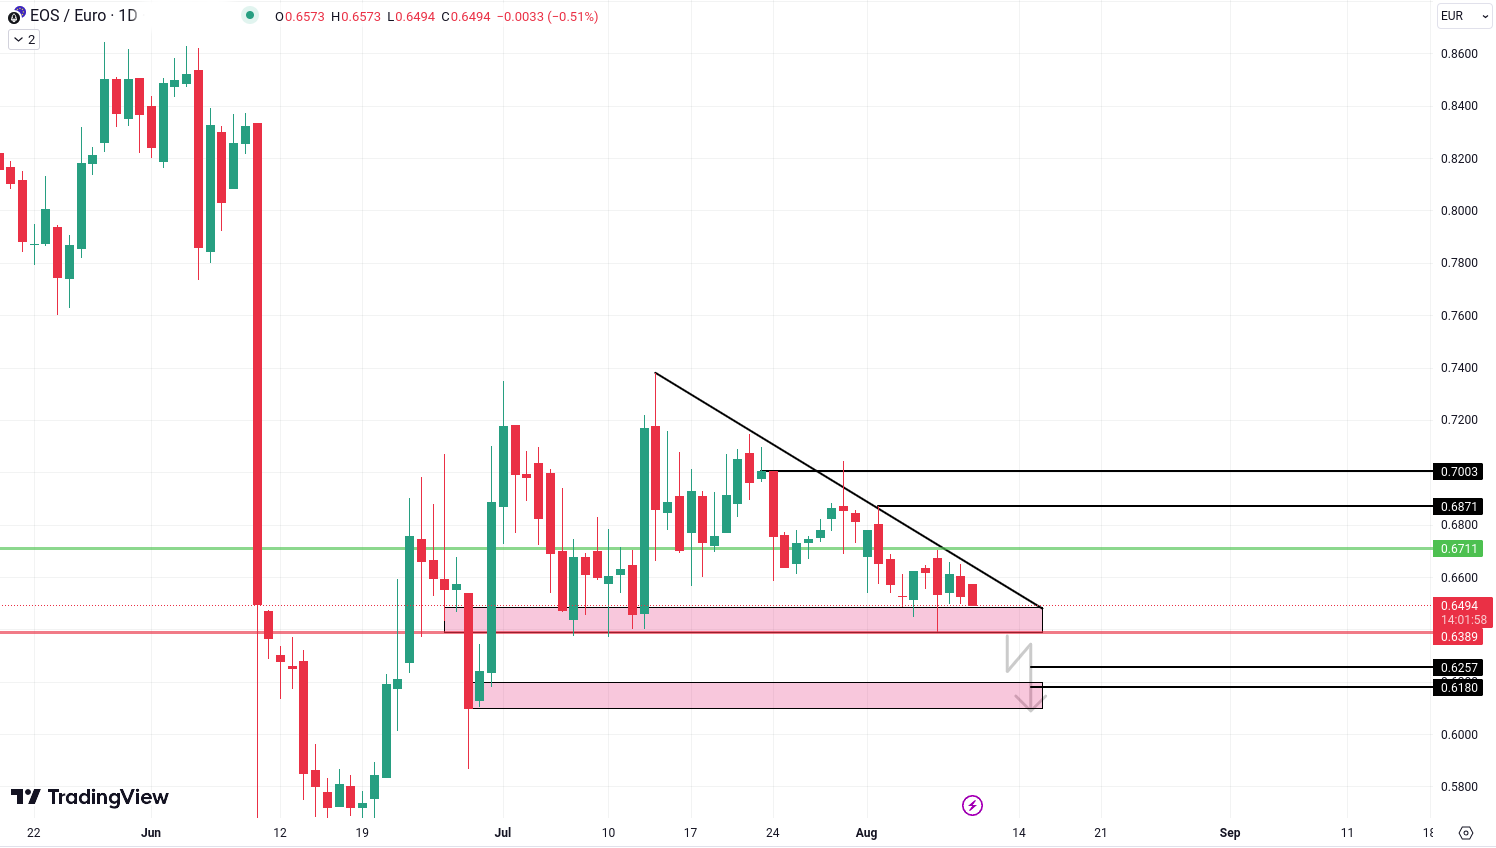
EOS/EUR has recently exhibited a price action that has given rise to the formation of a triangle pattern, characterized by the convergence of trendlines. At present, the price is undergoing consolidation in proximity to a pivotal support zone.
In the event that EOS/EUR successfully breaches both the upper trendline of the triangle pattern and the prior high of 0.6711 Euro, a bullish scenario could potentially materialize. Such a breakout could catalyze a surge in momentum, potentially setting the stage for targets at 0.6871 Euro and 0.7003 Euro.
Conversely, a breakdown beneath the critical support zone of 0.6389 Euro might signify a shift towards bearish price movement. Should such a scenario unfold, traders could potentially anticipate targets at 0.6257 Euro and 0.6180 Euro. Maintaining preparedness for both bullish and bearish outcomes is imperative for effective navigation of the market.
All the featured cryptocurrencies in this analysis, are available for trading on the Tradesilvania platform. Their prices can be tracked on the Tradesilvania price page, accessible through the following link: https://tradesilvania.com/en/prices
With Tradesilvania, you can deposit, withdraw, buy, or sell any of these cryptocurrencies using the free digital wallet.
Discover direct trading with fast SEPA on-ramp capabilities, 80+ SPOT tokens and over 2000 cryptocurrencies available trough our OTC Desk.
Limitation of Liability
This report issued by Tradesilvania is purely informative and is not intended to be used as a tool for making investment decisions in crypto-assets. Any person who chooses to use this report in the process of making investment decisions assumes all related risks. Tradesilvania SRL has no legal or other obligation towards the person in question that would derive from the publication of this report publicly.
The content provided on the Tradesilvania website is for informational purposes only and should not be considered as investment advice, financial advice, trading advice, or any other form of advice. We do not endorse or recommend the buying, selling, or holding of any cryptocurrency. It is important that you conduct your own research and consult with a financial advisor before making any investment decisions. We cannot be held responsible for any investment choices made based on the information presented on our website.
The information in this report was obtained from public sources and is considered relevant and reliable within the limits of publicly available data. However, the value of the digital assets referred to in this report fluctuates over time, and past performance does not indicate future growth.
Total or partial reproduction of this report is permitted only by mentioning the source.