Weekly crypto market analysis (6 - 12 Mar)


Tradesilvania provides a weekly analysis of the cryptocurrency market.
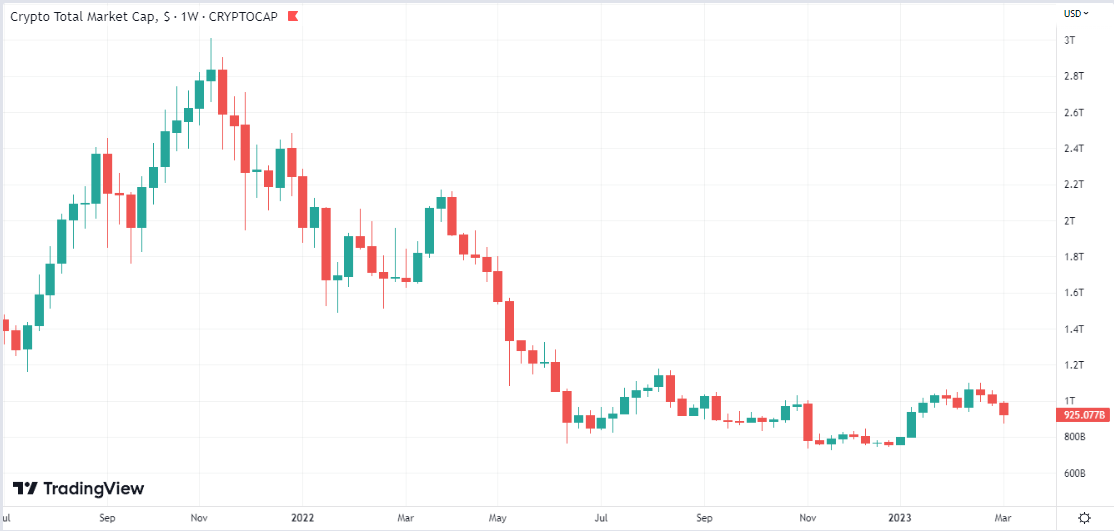
Crypto Market Evolution
International financial markets experienced significant turbulence last week. This affected the crypto market as well, where we saw a continuation of declines that began two weeks ago. Weak macroeconomic data and central banks’ commitment to raising interest rates to reduce inflation and tighten credit access caused investor sentiment to deteriorate. As a result, risk-sensitive assets such as stocks, commodities, and crypto experienced consistent sales.
The downward pressure intensified when Silicon Valley Bank (SVB) went bankrupt after depositors withdrew their deposits en masse. SVB was popular among technology start-ups including crypto entities like Circle, Avalanche and Yuga Labs. This bankruptcy sent shockwaves through the digital asset market. Additionally, Silvergate Bank’s holding company announced its cessation of activity and entry into liquidation earlier in the week. This was expected due to recent problems at Silvergate.
These negative events caused most crypto-assets to fall by more than 10% last week with SOL (-17%), AVAX (-15%), APE (-17%) or NEAR (-13%) being among the most affected top projects. Major financial institutions worldwide including European banking giants also recorded significant declines with daily drops exceeding 5% in some cases.
The total digital assets market capitalization has fallen below 950 billion USD, the lowest level in the last two months.
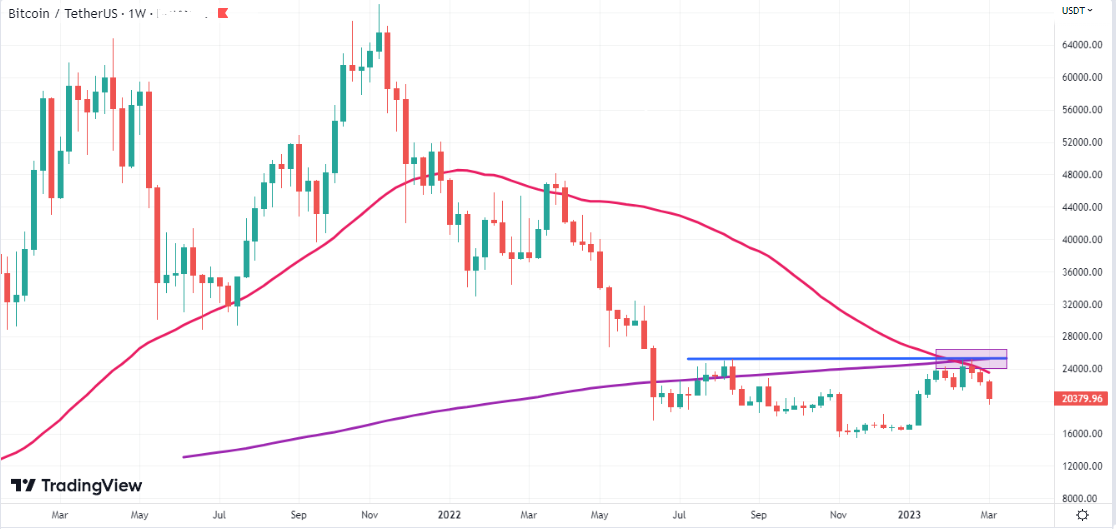
Bitcoin has depreciated by about 10% in the last 7 days, falling from a level of $22,500 to around $20,000.
This decline came amid a combination of negative news and events that caused the price to confirm its recent negative trend as described in our previous report.
The intersection of three important graphical indicators - 1) the 200-week moving average (purple curve) - a long-term trend indicator; 2) the 50-week moving average (orange curve) - an important medium-term trend indicator; and 3) the resistance line (blue color) marking the former recent high in the area of 25,000 USD - proved to be an extremely strong area in BTC’s evolution. The price failed to break above this level and was then significantly rejected back down.
In the coming period it will be very important to see what contagion effects SVB’s bankruptcy will have with the risk that other second-tier banks in the US may be affected by this event. If negative news continues and market tensions dominate it is possible that BTC’s downward trend could lead its price towards yearly lows in the area of $16,000-$17,000. In a positive scenario US financial authorities could intervene to limit the effects of this bank bankruptcy and bring calm among investors resulting in a rebound in risk assets including BTC.
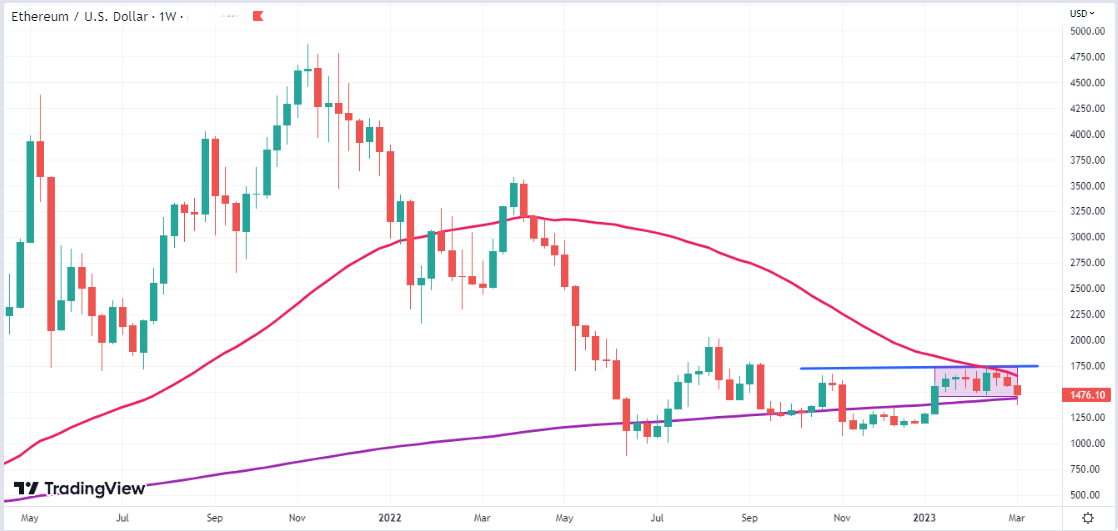
ETH fell below $1,500 last week in line with the general market trend.
The crypto asset of the Ethereum network maintains its trading zone delimited by its 200 and 50-week moving averages with its price fluctuating between $1,400-$1,750 over the last 8 weeks without a clear break in either direction.
This neutral territory in which ETH is moving may indicate short-term investor uncertainty about the overall direction of the crypto market. Even though we had a very good start to the year ETH’s oscillation shows that the general downward trend from last year has not yet been overcome. Usually during bull-market rallies ETH was one of the trailblazers but this has not happened in recent weeks.
On the other hand, ETH’s smaller decline compared to the market during this turbulent period shows that the $1,500-$1,600 level appears to be a long-term accumulation zone with buyers managing to keep its price above recent lows.
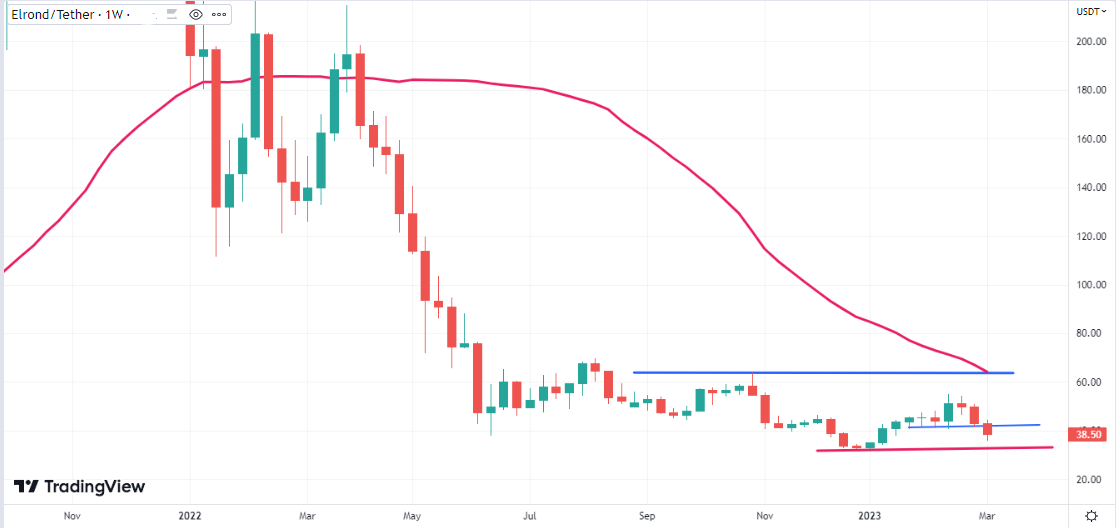
EGLD (MultiversX) fell below $40 last week for the first time in six weeks due to tensions felt in both the crypto market and international financial markets.
In such situations of generalised declines, individual technical characteristics of a project become secondary and the token’s evolution is influenced by overall market movements. The support line at $43 was broken downwards due to selling pressure and eGold even reached a level of $35.80 at one point which was its weekly low. If turbulence continues in the coming days it is not excluded that we could see a retest of lows in the area of $33. If the macro situation stabilises even temporarily a rebound above $40 can be expected.
Market moves over the last 7 days
| Cresteri | ||
|---|---|---|
| KAVA | +14% | |
| LEO | +9% | |
| - | - | |
| - | - | |
| - | - | |
| Scaderi | ||
|---|---|---|
| DASH | -30% | |
| SNX | -30% | |
| LTC | -24% | |
| IMX | -23% | |
| NEO | -23% | |
Limitation of Liability
This report issued by Tradesilvania is purely informative and is not intended to be used as a tool for making investment decisions in crypto-assets. Any person who chooses to use this report in the process of making investment decisions assumes all related risks. Tradesilvania SRL has no legal or other obligation towards the person in question that would derive from the publication of this report publicly.
The information in this report was obtained from public sources and is considered relevant and reliable within the limits of publicly available data. However, the value of the digital assets referred to in this report fluctuates over time, and past performance does not indicate future growth.
Total or partial reproduction of this report is permitted only by mentioning the source.