Market update and analysis for BTC, ETH, EGLD, AAVE and PEPE - June 25, 2024


Crypto Market in the last 24h:
🌐 Global Market Cap: $2.26T (-0.29%)
📊 Total 24h Volume: $95.91B (+87.85%)
💰 DeFi Volume: $6.36B (6.63% of total volume)
🔒 Stablecoin Volume: $89.18B (92.98% of total volume)
💵 Bitcoin Dominance: 53.38% (-0.79%)
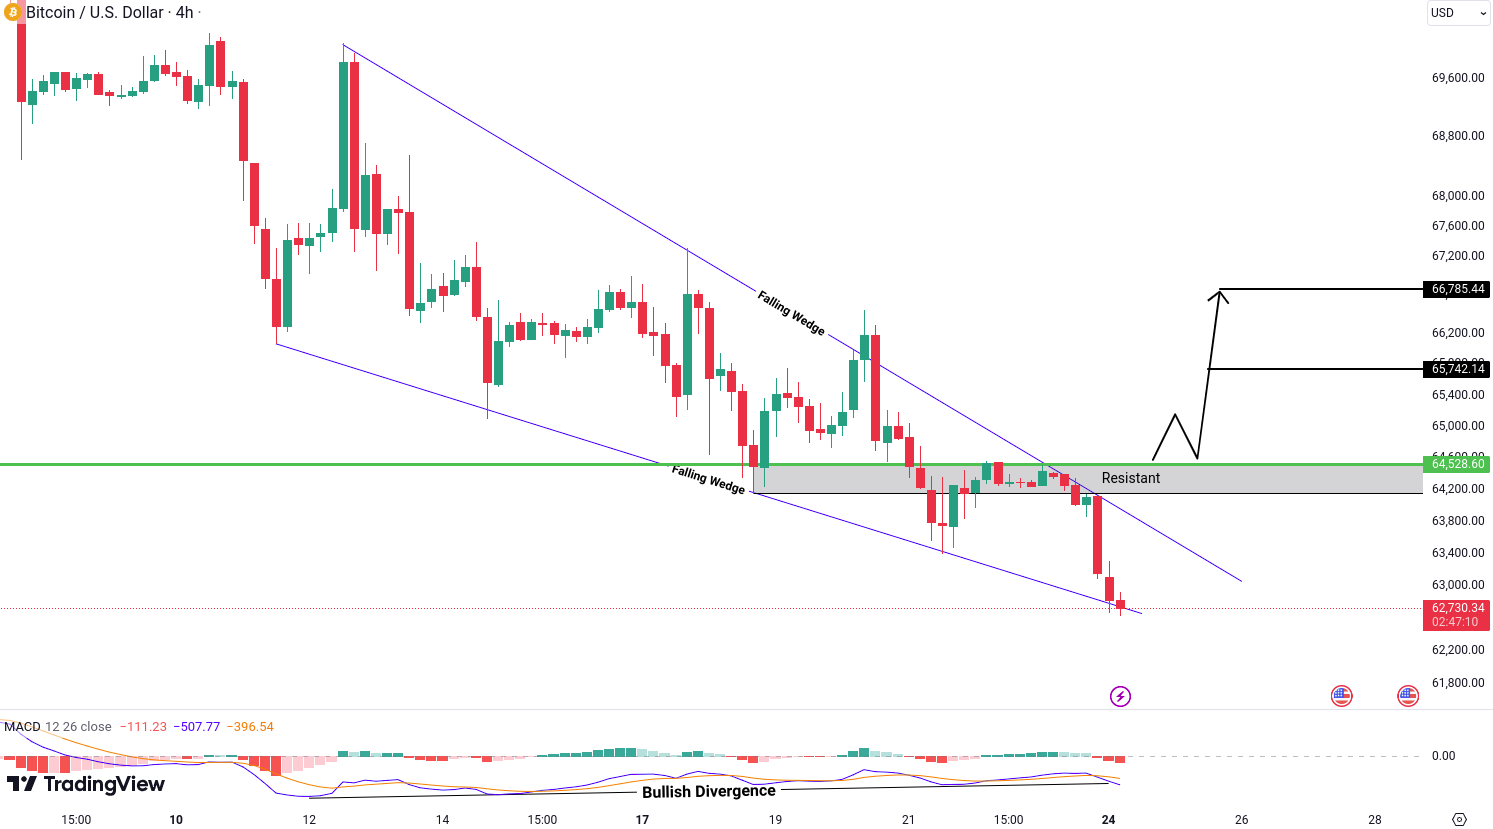
Bitcoin (BTC) Analysis
BTC shows bullish potential with the formation of a falling wedge pattern and bullish divergence. A falling wedge often signals a reversal, and bullish divergence indicates momentum shifting towards bulls. We focus on the bullish side, despite the falling knife scenario, which can be risky.
Watch for a breakout above 64,528 USD to confirm the bullish move, targeting 65,742 USD and 66,785 USD.
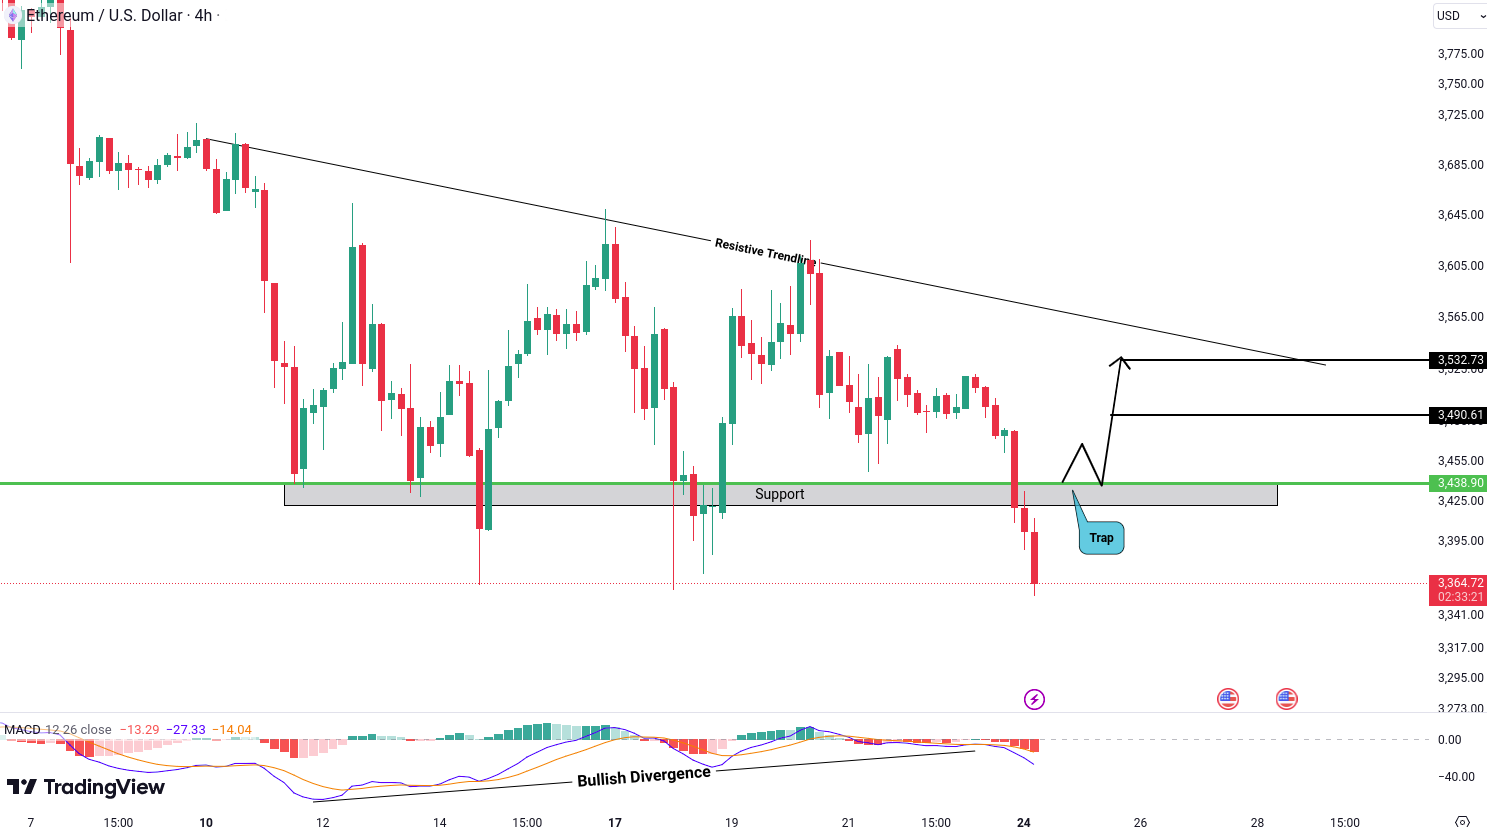
Ethereum (ETH) Analysis
ETH recently broke through a support zone, and a significant move has occurred. Now, it might be prudent to watch for a bullish move. Additionally, bullish divergence increases the probability of an upward move.
To confirm this bullish move, the price needs to break out above 3,438 USD. This breakout would likely lead to gains towards targets of 3,490 USD and 3,532 USD.
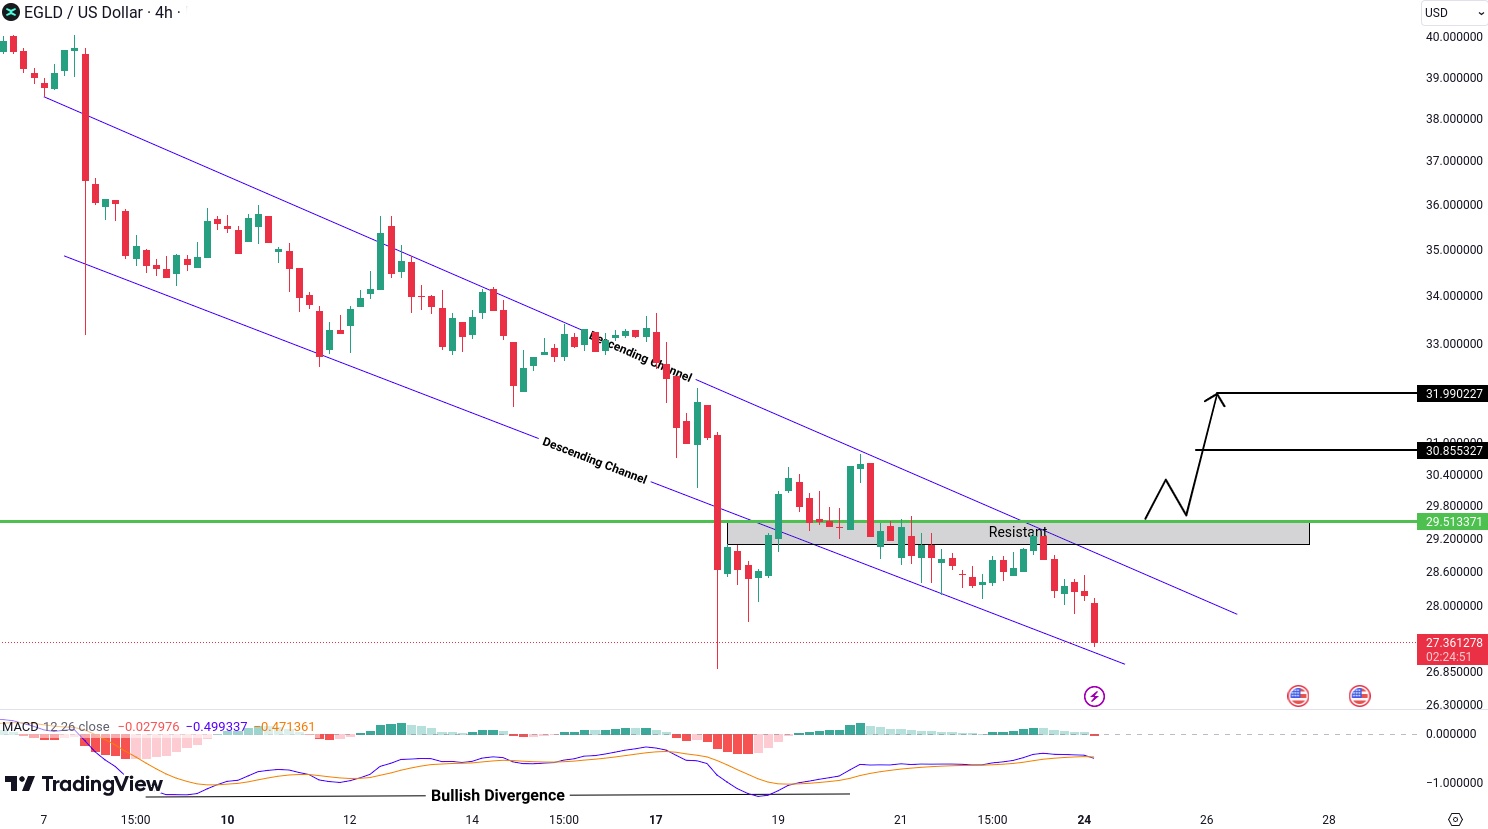
MultiversX (EGLD) Analysis
EGLD has formed a descending channel, generally a bullish reversal pattern, along with bullish divergence. Together, these factors increase the probability of a bullish move.
To confirm this bullish move, the price needs to break out above the descending channel and the resistance zone at 29.51 USD. This breakout would likely lead to further gains towards targets of 30.85 USD and 31.99 USD.
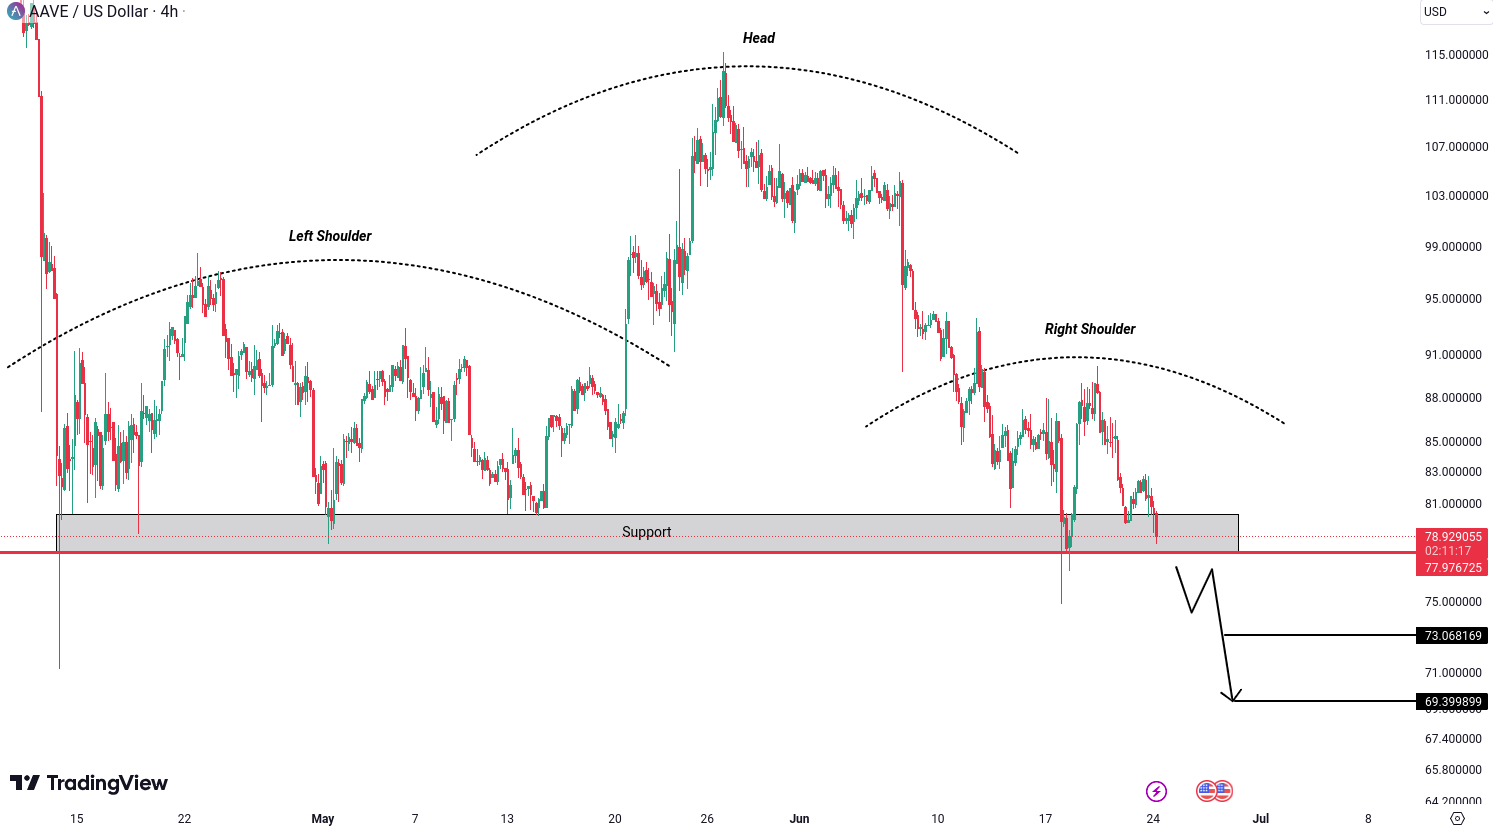
Aave (AAVE) Analysis
AAVE has formed a head and shoulders pattern, a classic bearish pattern, and the overall trend leans towards the bearish side. Together, these factors increase the probability of a bearish move.
To confirm this bearish scenario, we need a breakdown and candle closing below the support level of 79.41 USD. This breakdown would likely lead to further declines towards targets of 73.06 USD and 69.39 USD.
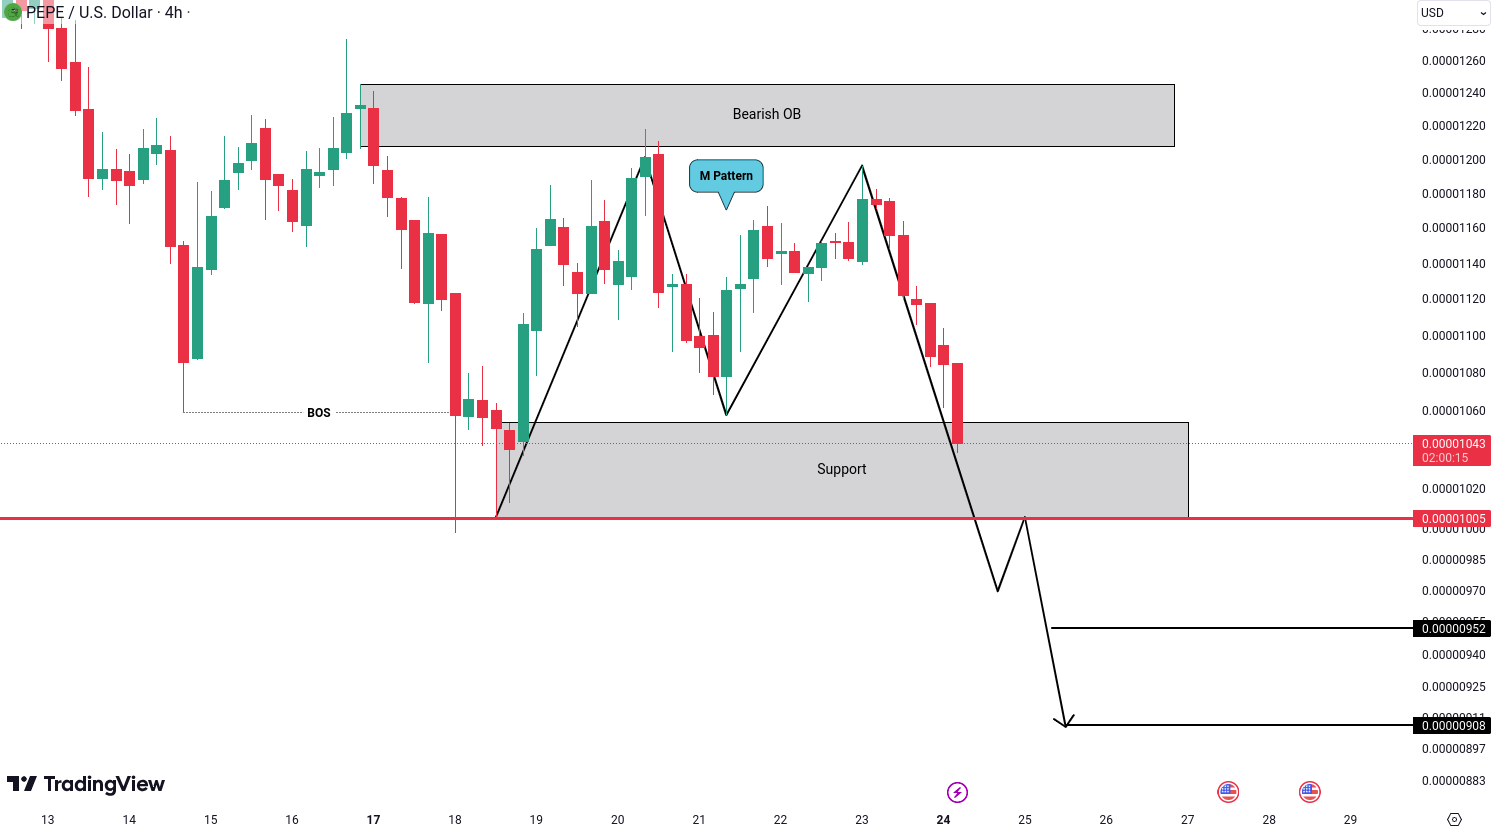
Pepe (PEPE) Analysis
PEPE shows bearish potential with the formation of an M pattern and a break of structure towards the bearish side. Resistance at the bearish OB and the M pattern indicate further downward movement. Watch for a breakdown below 1,005 USD to confirm the bearish move, targeting 952 USD and 908 USD.
All cryptocurrencies are available for trading on Tradesilvania , and their prices can be seen on the Tradesilvania price page, accessible through the following link: https://tradesilvania.com/en/prices
With the help of our platform, you can deposit, withdraw, buy or sell any of these cryptocurrencies using the free digital wallet. SEPA Top-up (On-Ramp & Off-Ramp) Euro and RON instant transfers and over 100 cryptocurrencies, are all available in our app.

Limitation of Liability
This report issued by Tradesilvania is purely informative and is not intended to be used as a tool for making investment decisions in crypto-assets. Any person who chooses to use this report in the process of making investment decisions assumes all related risks. Tradesilvania SRL has no legal or other obligation towards the person in question that would derive from the publication of this report publicly.
The content provided on the Tradesilvania website is for informational purposes only and should not be considered as investment advice, financial advice, trading advice, or any other form of advice. We do not endorse or recommend the buying, selling, or holding of any cryptocurrency. It is important that you conduct your own research and consult with a financial advisor before making any investment decisions. We cannot be held responsible for any investment choices made based on the information presented on our website.
The information in this report was obtained from public sources and is considered relevant and reliable within the limits of publicly available data. However, the value of the digital assets referred to in this report fluctuates over time, and past performance does not indicate future growth.
Total or partial reproduction of this report is permitted only by mentioning the source.