Market update and analysis for BTC, ETH, EGLD, APE and KSM - July 22, 2024

Crypto Market in the last 24h:
🌐 Global market cap: $2.46T (+0.98%)
📊 Total 24h volume: $78.38B (+59.17%)
💰 DeFi volume: $5.34B (6.81% of total volume)
🔒 Stablecoins volume: $69.86B (89.12% of total volume)
💵 Bitcoin dominance: 54.29% (+0.07%)
Bitcoin (BTC) Analysis
BTC can form an M pattern and is showing bearish divergence on the MACD, which increases the probability of a bearish move.
If the price breaks down below the confirmation level of 65,689 USD, it could signal a bearish reversal, with potential targets at 64,896 USD and 64,188 USD. This setup is strengthened by the bearish divergence, indicating that the underlying momentum supports a downward move. Monitor the price action and use proper risk management to navigate this trade setup effectively.
Ethereum (ETH) Analysis
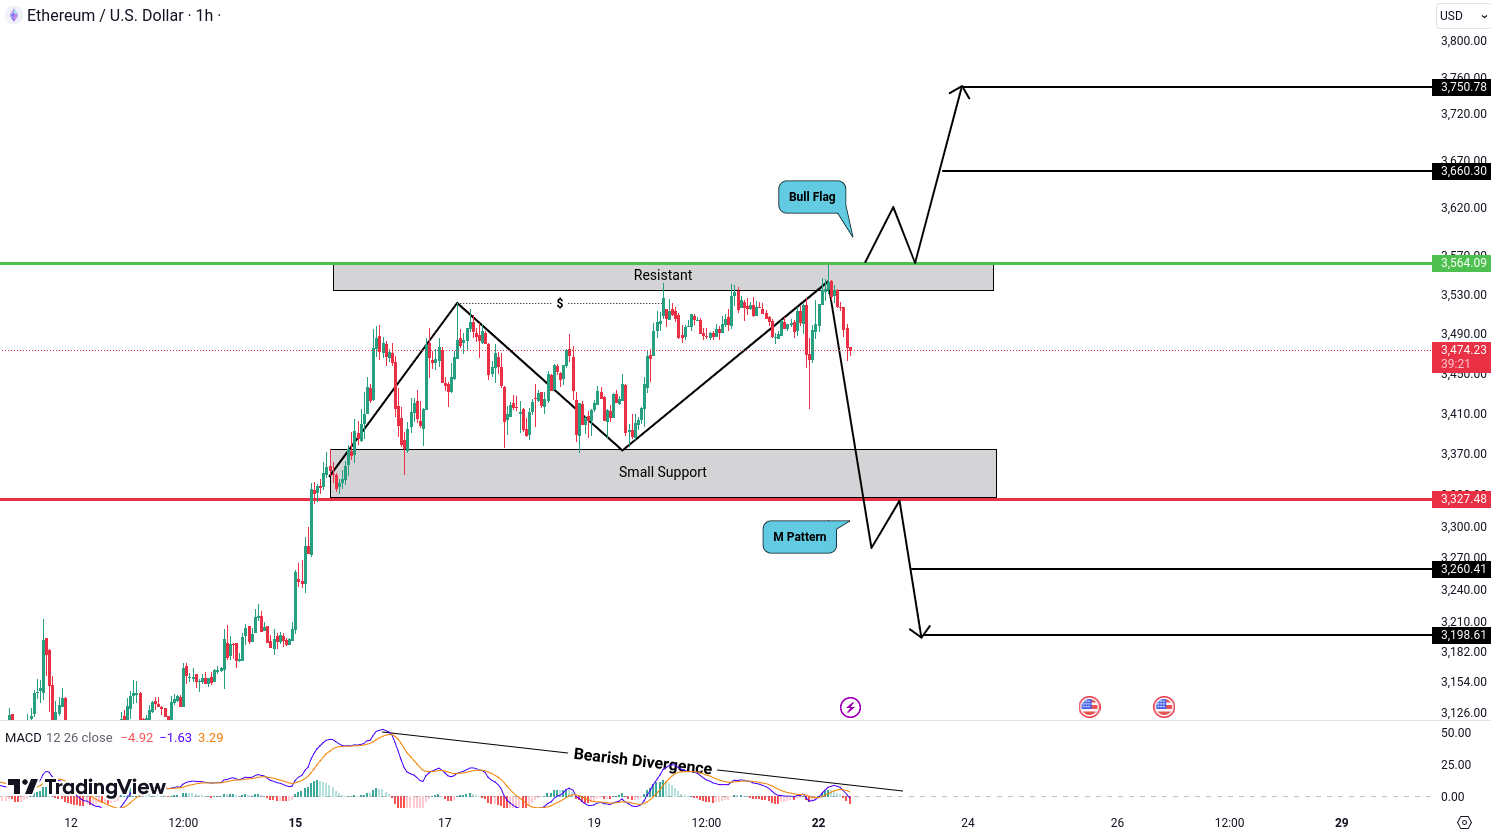
ETH is presenting trading opportunities for both bullish and bearish scenarios.
On the bearish side, the formation of an M pattern, combined with bearish divergence, is increasing the probability of a downward move. The M pattern, a classic bearish reversal pattern, indicates potential weakness after an uptrend, while the bearish divergence on momentum indicators suggests declining buying pressure. For confirmation of this bearish outlook, we need to see a breakdown below the crucial support level of 3,327 USD. If this level is breached, it could lead to targets of 3,260 USD and 3,198 USD.
Conversely, on the bullish side, ETH/USD is exhibiting a bull flag pattern, a continuation pattern that suggests potential further gains after a period of consolidation. This structure points to the likelihood of resuming the previous uptrend if a breakout occurs. For confirmation of this bullish scenario, we need a breakout above the resistance level of 3,564 USD. Such a breakout would increase the probability of a bullish move, potentially leading to targets of 3,660 USD and 3,750 USD.
MultiversX (EGLD) Analysis
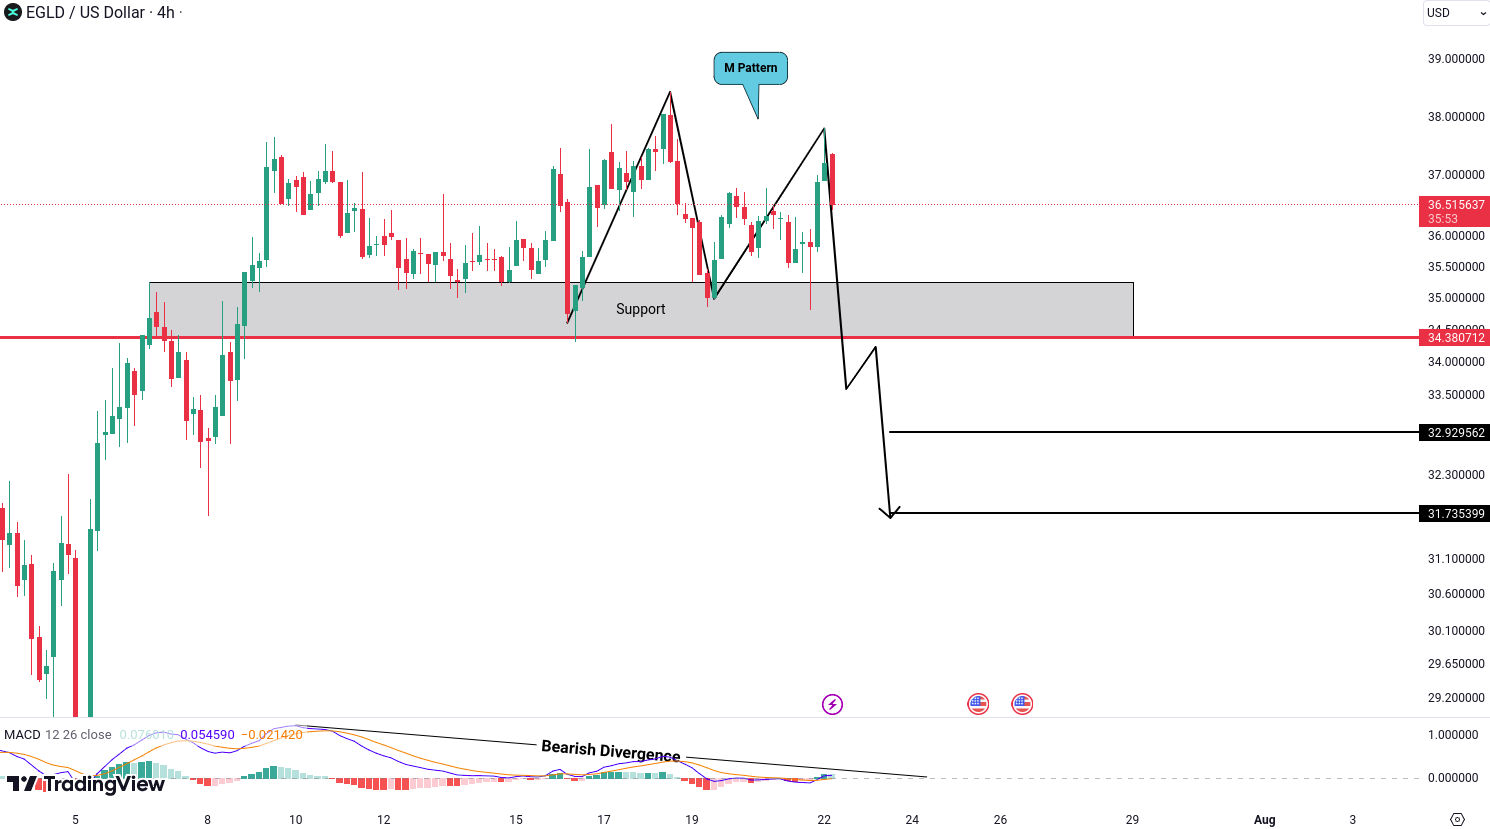
EGLD is forming an M pattern with bearish divergence, which increases the probability of a bearish move.
For confirmation of this bearish outlook, we need to see a breakdown below the key support level of 34.38 USD. If this level is breached, it could open the door to targets of 32.92 USD and 31.73 USD.
ApeCoin (APE) Analysis
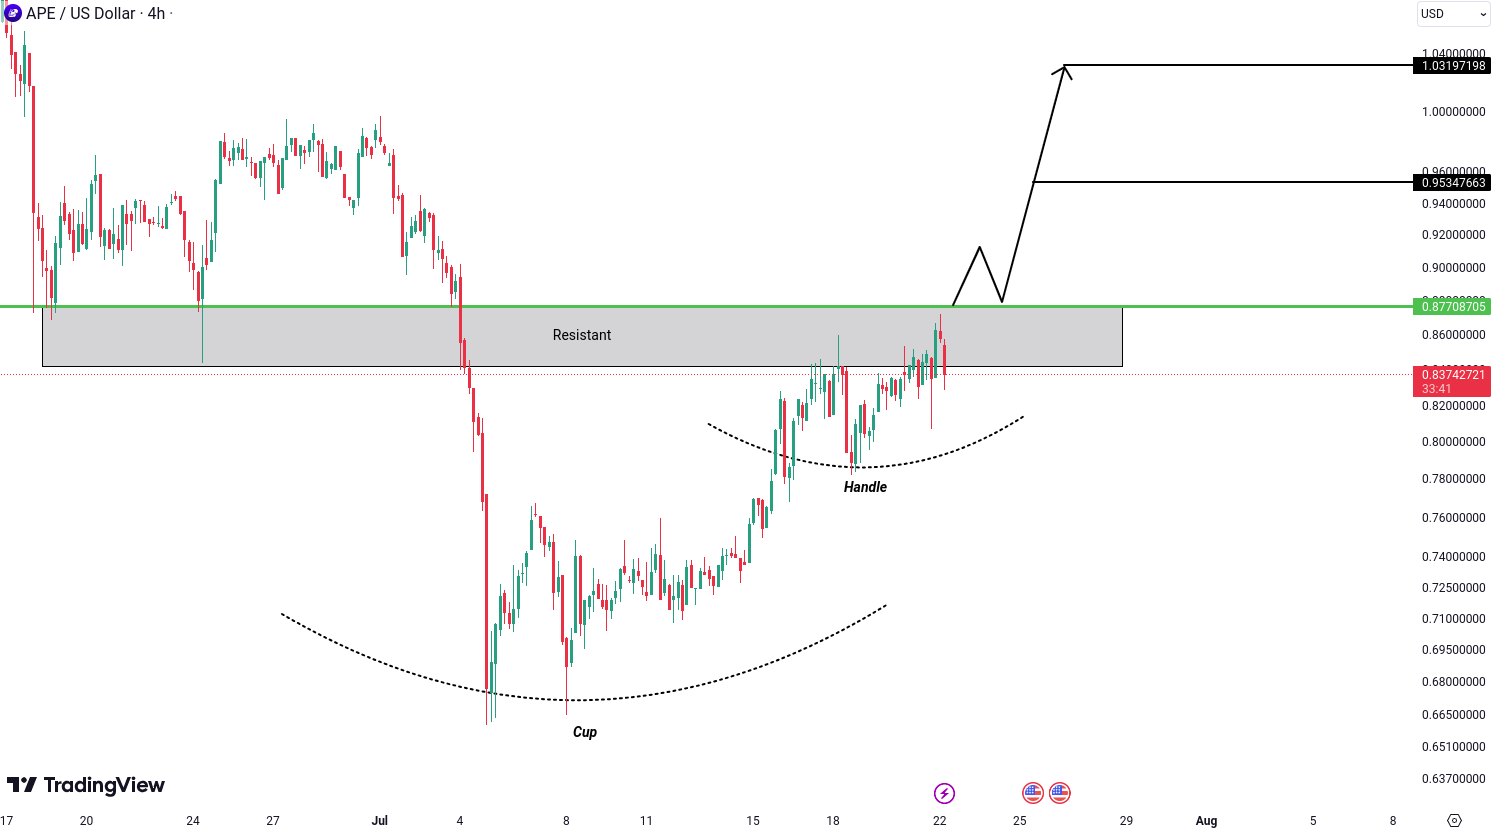
APE has formed a cup and handle pattern, which is a bullish continuation pattern indicating a potential upward move. For confirmation of this bullish move, we need to see a breakout above the key level of 0.87708705 USD. If the price successfully breaks this resistance, it could open the path to higher targets, specifically at 0.95347663 USD and 1.03197198 USD.
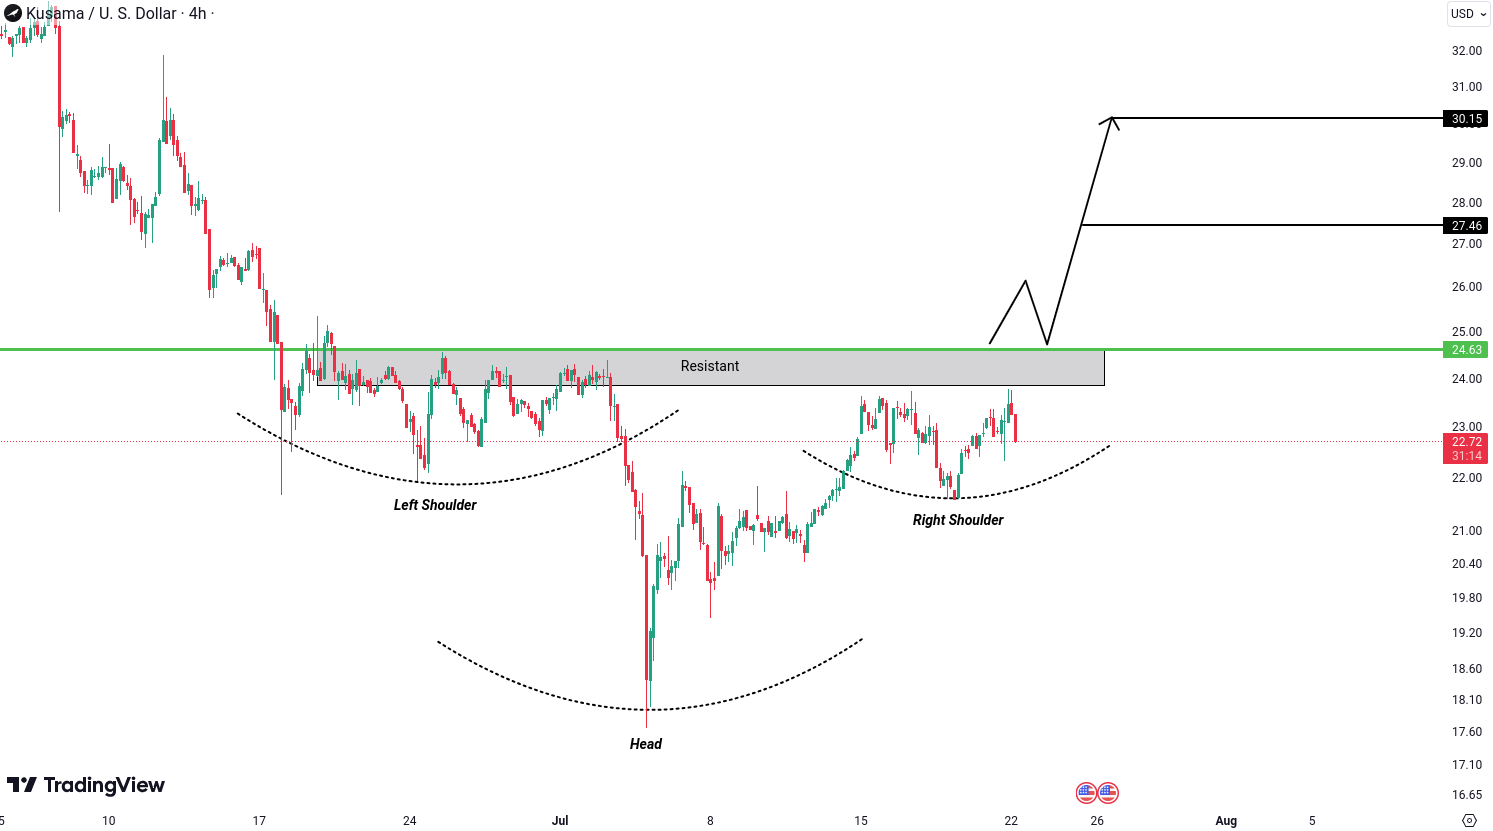
Kusama (KSM) Analysis
KSM has formed an inverse head and shoulders pattern, which is a bullish reversal pattern indicating a potential upward movement. This pattern, typically seen at the bottom of a downtrend, suggests that the selling pressure is weakening and a trend reversal might be imminent. For confirmation of this bullish reversal, we need to see a breakout above the key level of 24.63 USD. If the price successfully breaks this resistance, it could lead to higher targets of 27.46 USD and 30.15 USD.
All cryptocurrencies are available for trading on Tradesilvania , and their prices can be seen on the Tradesilvania price page, accessible through the following link: https://tradesilvania.com/en/prices
With the help of our platform, you can deposit, withdraw, buy or sell any of these cryptocurrencies using the free digital wallet. SEPA Top-up (On-Ramp & Off-Ramp) Euro and RON instant transfers and over 100 cryptocurrencies, are all available in our app.

Limitation of Liability
This report issued by Tradesilvania is purely informative and is not intended to be used as a tool for making investment decisions in crypto-assets. Any person who chooses to use this report in the process of making investment decisions assumes all related risks. Tradesilvania SRL has no legal or other obligation towards the person in question that would derive from the publication of this report publicly.
The content provided on the Tradesilvania website is for informational purposes only and should not be considered as investment advice, financial advice, trading advice, or any other form of advice. We do not endorse or recommend the buying, selling, or holding of any cryptocurrency. It is important that you conduct your own research and consult with a financial advisor before making any investment decisions. We cannot be held responsible for any investment choices made based on the information presented on our website.
The information in this report was obtained from public sources and is considered relevant and reliable within the limits of publicly available data. However, the value of the digital assets referred to in this report fluctuates over time, and past performance does not indicate future growth.
Total or partial reproduction of this report is permitted only by mentioning the source.