Weekly crypto market analysis (8 - 14 May)

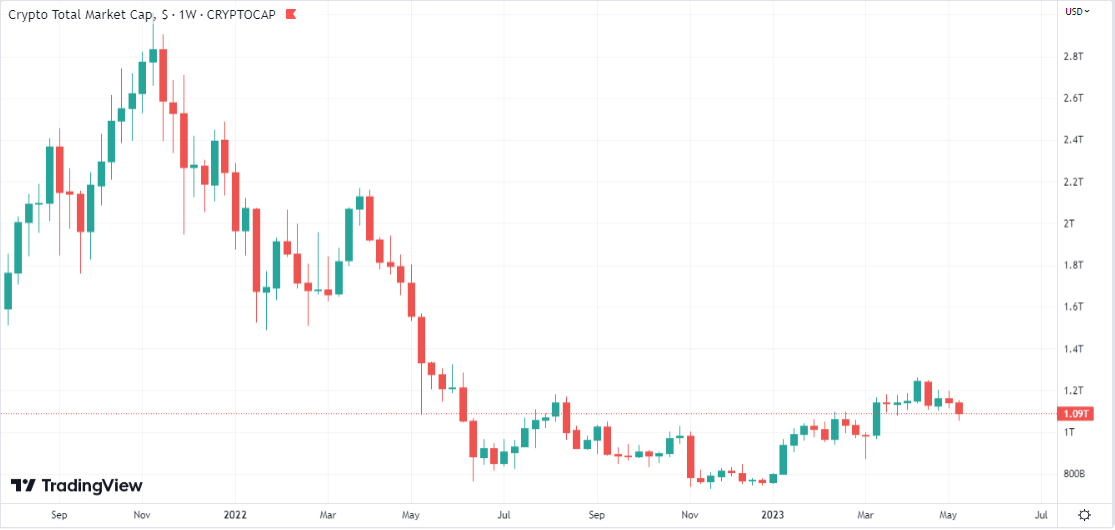
The crypto market has experienced a week of corrections, with the total market capitalisation of digital assets losing approximately 8% over the past 7 days.
This decline came amid a reduction in risk appetite among international financial market investors and a continuation of the selling trend that began in mid-April in the crypto market.
Data on inflation in the US, released on Wednesday May 10th, showed a slowdown in the annual rate of price increases compared to initial estimates. However, inflationary pressures remain high, causing international stock market players to be cautious regarding central bank movements. It is not excluded that they will continue monetary tightening cycles. Additionally, the prospect of a global recession, even if short-lived, is still present in the market.
As a result, risk-sensitive investment assets performed modestly, with stock markets ending the week in negative territory. This trend was also reflected in the crypto market. In this context, Bitcoin (BTC) and Ethereum (ETH) fell by 7% and 5%, respectively, over the past 7 days, with most major crypto assets experiencing depreciation.
The total market capitalisation of digital assets fell below the threshold of $1.10 trillion.

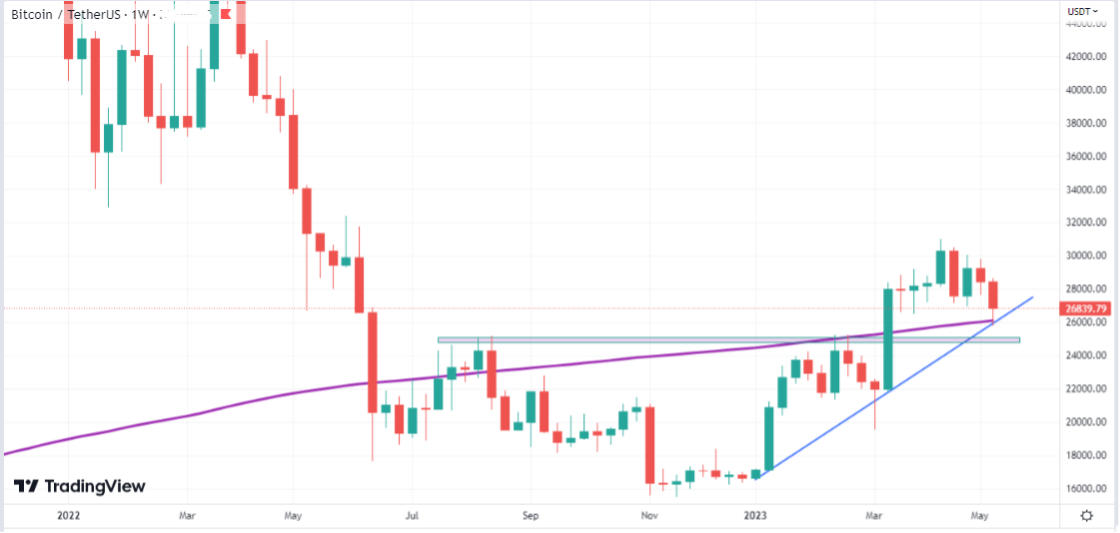
Bitcoin had a negative week, with its price falling below the support zone of $27,500 for the first time since March.
The most well-known crypto asset briefly fell below $26,000 after information emerged that the US Government had introduced sell orders for BTC confiscated over time in cases of crypto fraud.
BTC reached the confluence zone between the ascending trend line (blue) that began in January and the 200-week Moving Average (purple curve) on the decline. This zone acted as support, with the price rebounding upwards from here towards $27,000.
Chart analysis indicates a downward trend in recent weeks, beginning in mid-April. BTC made new lows in May after reaching its yearly high at $30,000.
If the short-term downward trend continues and the price breaks below $26,000, we may see BTC fall to $25,000 where we have a former resistance zone on an upward trajectory that could now prove to be an important support.
The scenario of a consistent upward rebound from the confluence of the trend line and 200-week Moving Average, boosted by a rise above $28,000, could confirm the end of the short-term correction and re-entry into an upward trend.
As mentioned in previous reports, it is important to monitor the correlation between movements on international stock markets and the crypto market. This is due to investor sentiment regarding the trend for the coming months being uncertain amid deteriorating global economic conditions.

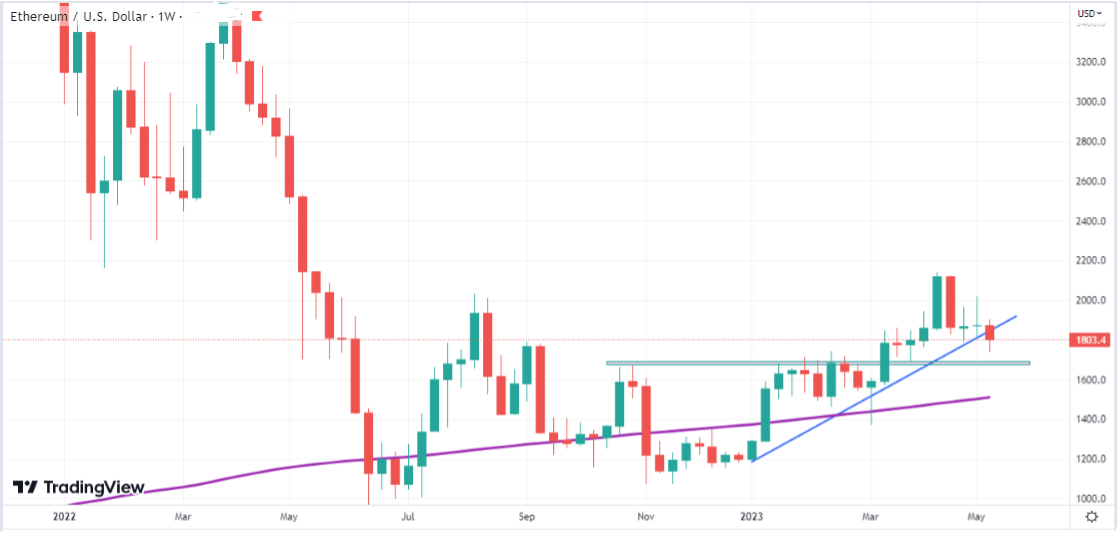
ETH fell by approximately 5% in the recently concluded week to a level of $1,800. The selling trend on BTC was felt throughout the crypto market, with ETH following Bitcoin’s direction and breaking below the growth trend line that began at the start of the year.
The price fell below $1,750 on Friday when we saw a short-lived abrupt decline across all coins under the influence of rumours indicating possible BTC selling activity by US authorities. In the latter part of the week, ETH rebounded and stabilised around $1,800.
If the downward pattern indicated by technical analysis showing the crossing below the trend line is confirmed, we may see a continuation of the downward trend on ETH to $1,650 where we find a former important resistance zone. Ether had difficulty crossing this zone on an upward trajectory in previous months.
Thus, according to chart analysis theory, that price zone could transform into support from where the price could rebound upwards.
The price chart pattern on ETH is relatively uncertain without a high probability scenario for fulfillment. It is therefore important to see what BTC will do in the coming period given its essential influence on the evolution of ETH and other digital coins.

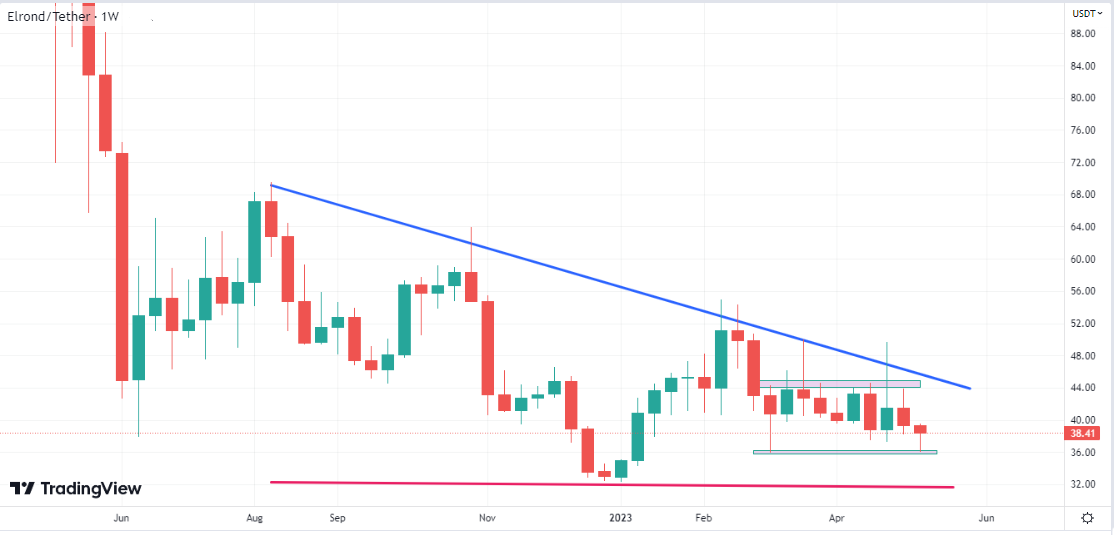
EGLD ended the week around the $38, slightly lower from its level on May 7th. The MultiversX network token fell to $36 during the week amid generalized market declines, reaching its lowest level in recent months.
The price rebounded upwards, confirming the $36 level as support on a downward trajectory. This support must hold to prevent the scenario of a drop to $32 from materialising.
The fact that investors on EGLD managed to bring the price back to $38, where eGold has converged every time in the past 4 weeks, indicates increased buying interest at this level.
In the event of a market recovery, we could have the $36-38 zone confirmed as a major support zone and multi-month low.
For a bullish scenario, EGLD must make new weekly and monthly highs with convincing rises above $40, $45 and $50 respectively to cancel out the major downward trend. Until then, it is essential that the $36 zone is not decisively broken below to avoid re-testing December 2022 lows at $32.
The general direction of the market will dictate EGLD’s movements in the coming period. Thus, in analysing the individual evolution of the MultiversX network token, we must carefully look at the overall situation in the crypto market.

Limitation of Liability
This report issued by Tradesilvania is purely informative and is not intended to be used as a tool for making investment decisions in crypto-assets. Any person who chooses to use this report in the process of making investment decisions assumes all related risks. Tradesilvania SRL has no legal or other obligation towards the person in question that would derive from the publication of this report publicly.
The information in this report was obtained from public sources and is considered relevant and reliable within the limits of publicly available data. However, the value of the digital assets referred to in this report fluctuates over time, and past performance does not indicate future growth.
Total or partial reproduction of this report is permitted only by mentioning the source.