
Crypto this week - 25 July 2023


Crypto Market Update for the last 24h
💹 Global Crypto Market Cap: €1.06T (↓1.82%)
📉 Total Crypto Market Volume €30.76B (↑39.70%)
💹 DeFi Volume (24h): €2.89B (7.67% din volum)
💱 Stablecoin Volume (24h): €21.98B (91.59%)
₿ Bitcoin Dominance: 48.04% (↑0.22%)
Bitcoin (BTC) analysis and update
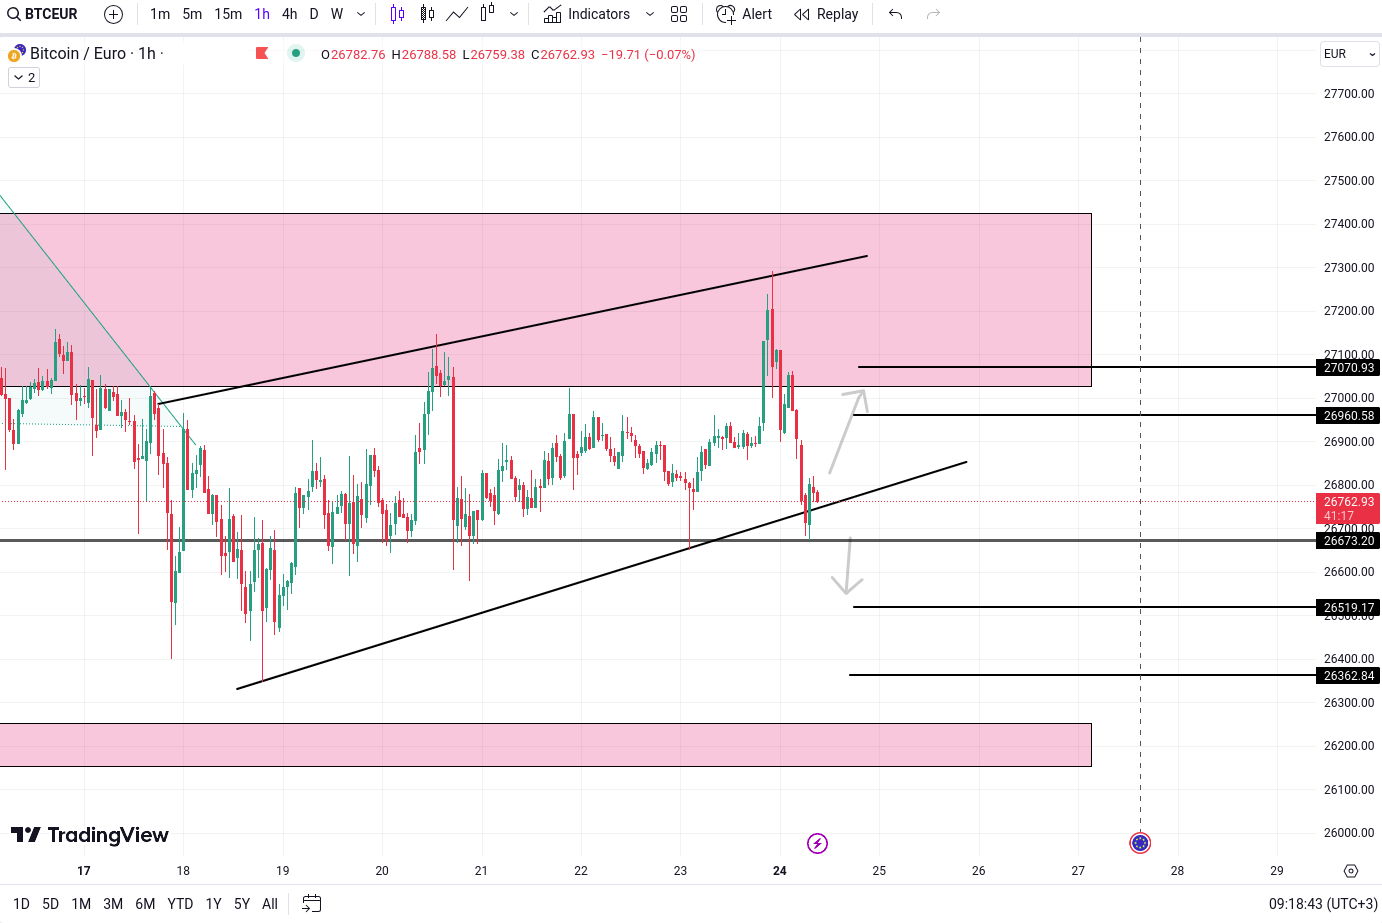
BTC/EUR is currently exhibiting a rising wedge pattern, a noteworthy formation drawing the attention of seasoned traders familiar with technical analysis.
Additionally, BTC/EUR is hovering close to a critical support zone, presenting two potential scenarios in this situation. Should the asset find support at this level, traders could anticipate price targets at 26,960 Euro and 27,070 Euro. On the other hand, if BTC/EUR breaches the 26,673 Euro level, traders may set their sights on targets at 26,519 Euro and 26,362 Euro. These levels are crucial potential support zones where price rebounds might occur.
Taking into account the recent consolidation and the lack of a well-defined trend leading up to the Federal Reserve meeting, it is anticipated that BTC/EUR will experience a sideways market throughout this week. The uncertain market direction warrants a prudent approach to trading decisions. During such times when clear trends are absent, traders may opt to avoid significant positions and exercise caution in their trading strategies.
Ethereum (ETH) analysis and update
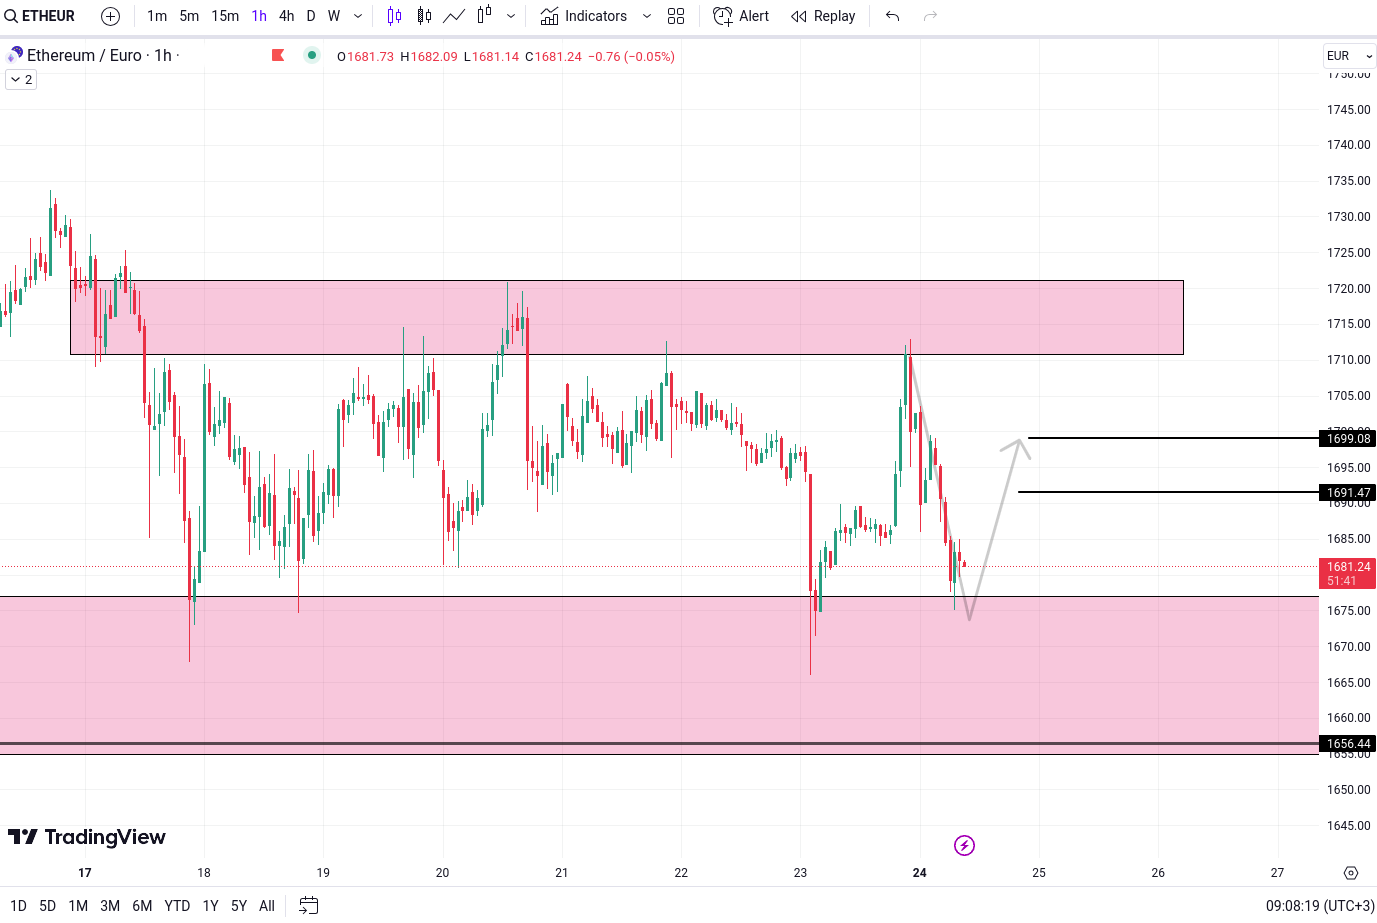
ETH/EUR's current price is in close proximity to the support zone, prompting the potential formation of a W pattern. A W pattern is indicative of a possible bullish trend reversal, which could lead to higher price targets at 1,691 Euro and 1,699 Euro.
MultiversX (EGLD) analysis and update
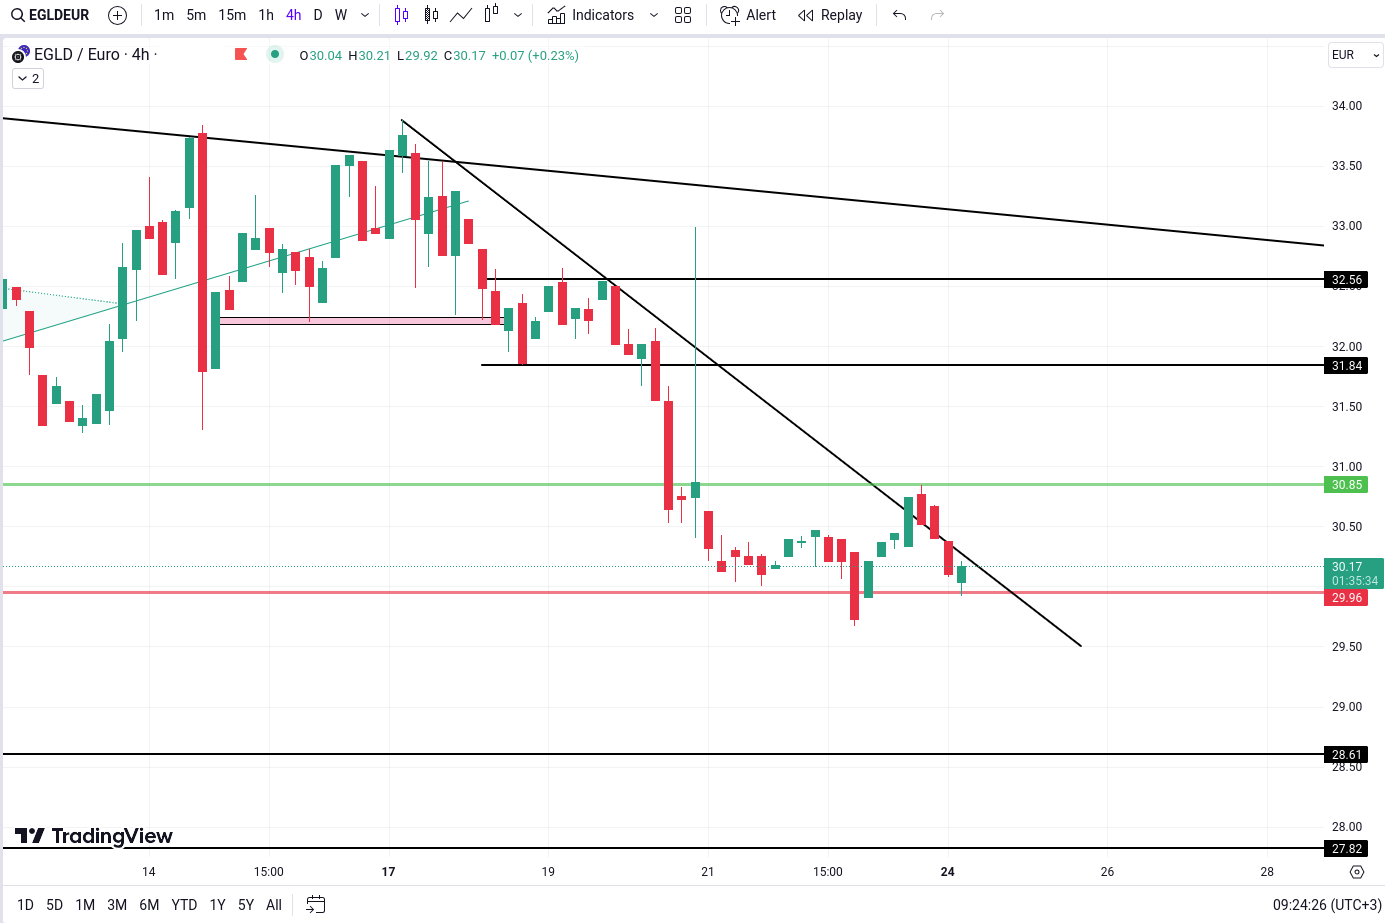
EGLD/EUR's current price is hovering close to the critical support and resistance levels. A breach below the support level could trigger downward targets at 28.61 and 27.82 EUR. Conversely, a successful breakthrough above the resistance level might pave the way for the formation of a W pattern, potentially driving prices towards targets of 31.84 and 32.56 EUR.
Ripple (XRP) analysis and update
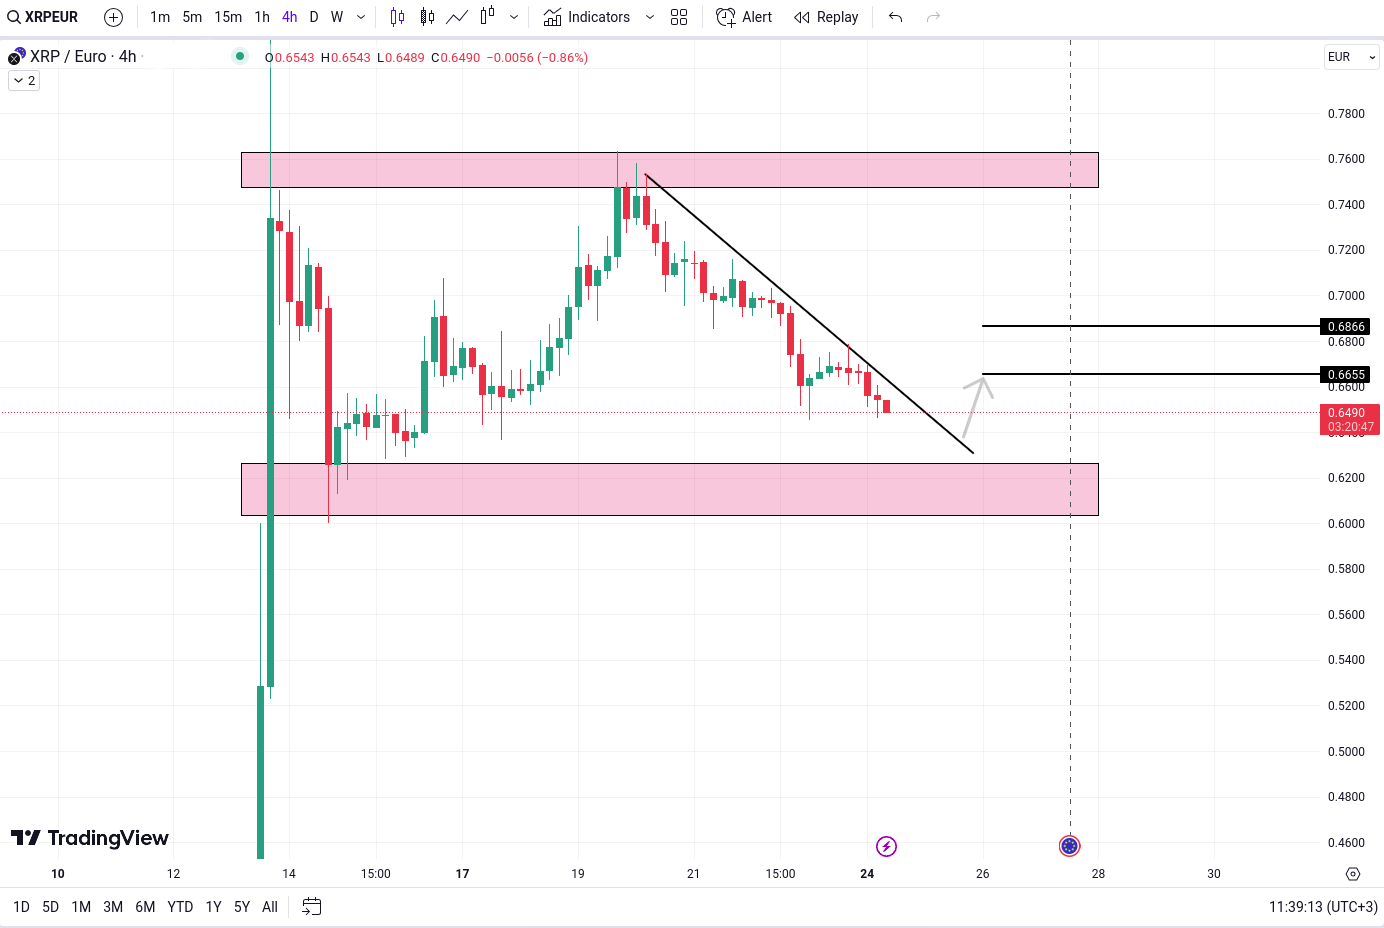
XRP/EUR is currently adhering to a trendline, and despite its previous bullish trend, the asset is now undergoing consolidation near a crucial support level. Traders should closely observe the potential for a trendline break, as this could trigger additional bullish movement, with anticipated targets at 0.6655 Euro and 0.6866 Euro. We will provide long-term targets in the future.
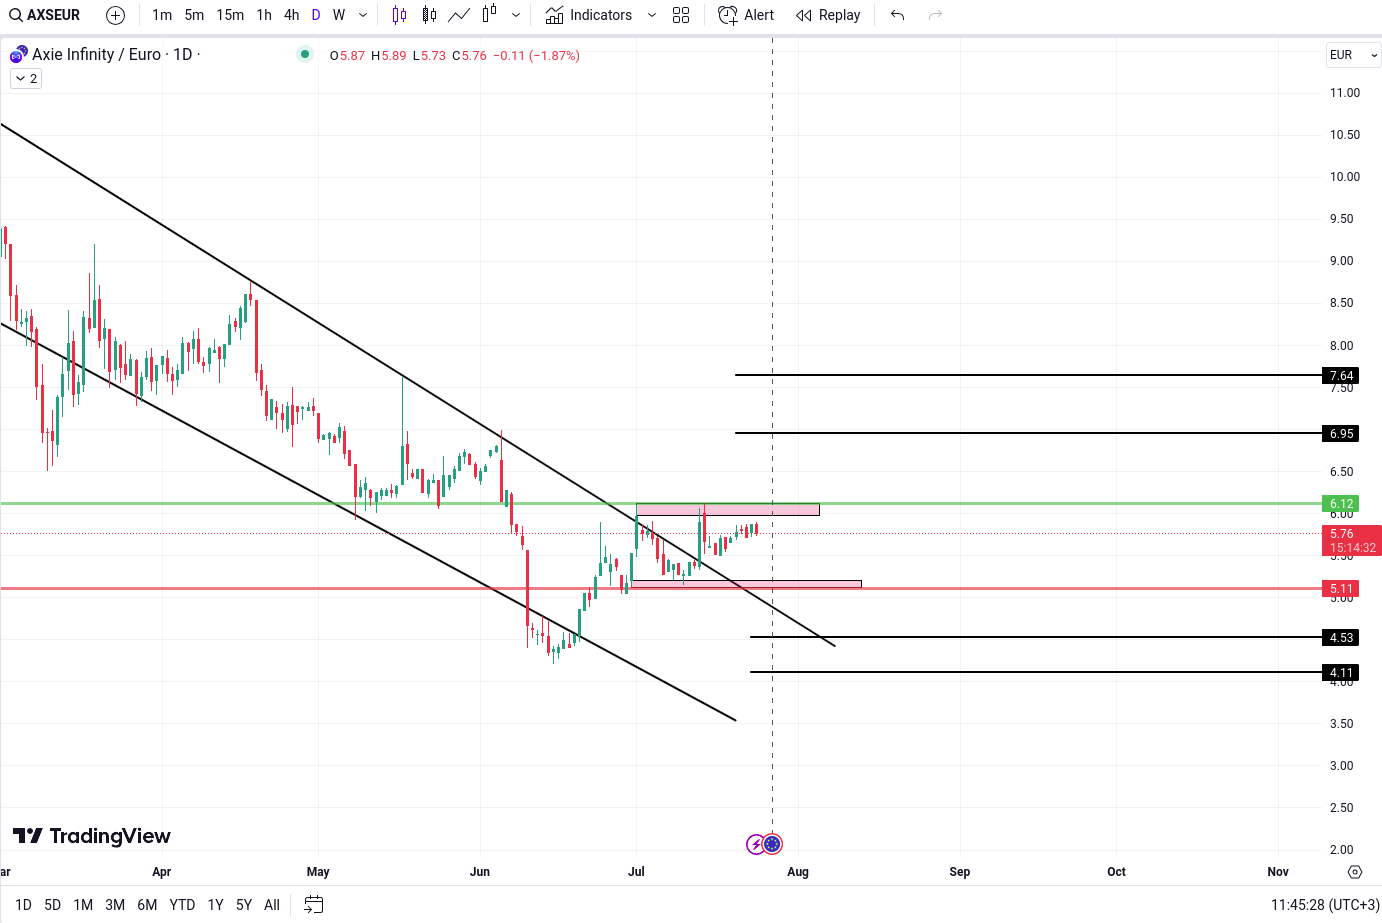
AXE analysis and update
AXE/EUR has successfully broken out of its falling wedge pattern. Currently, the asset is in a consolidation phase within a defined range. A decisive breakout above the 6.12 Euro level may indicate the potential for bullish movement, with projected targets at 6.95 Euro and 7.64 Euro. On the other hand, if the price breaks down below the 5.11 Euro level, it could signal bearish implications, with potential targets at 4.53 Euro and 4.11 Euro.
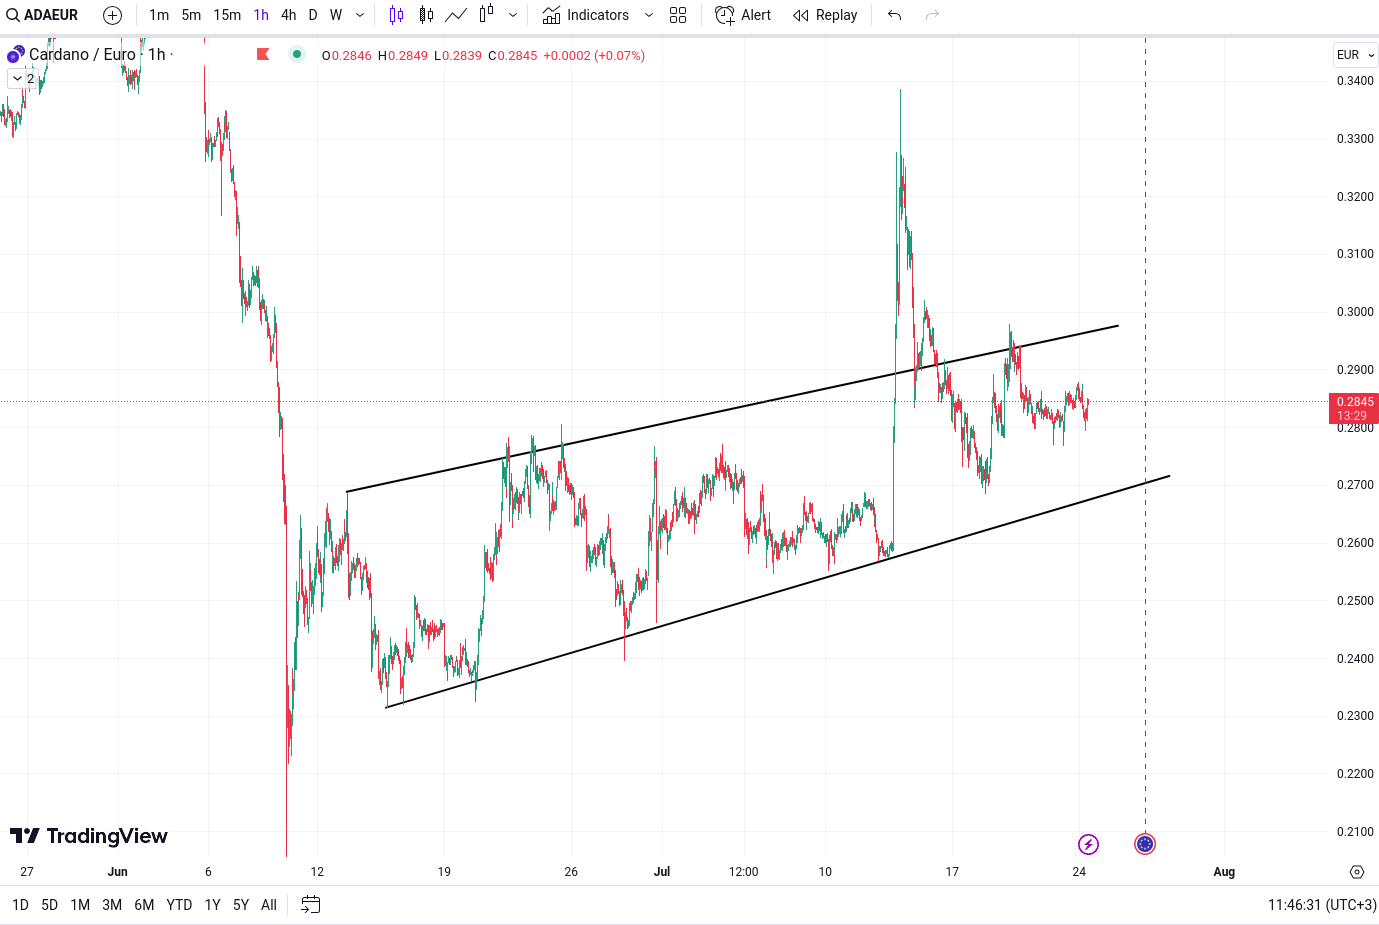
Cardano (ADA) analysis and update
ADA/EUR recently broke out from a rising wedge pattern. However, the asset retraced back under the pattern again, which raises questions about the sustainability of the upward trend. Traders are advised to closely monitor ADA/EUR's price action as trapped bulls suggest an impending significant movement.
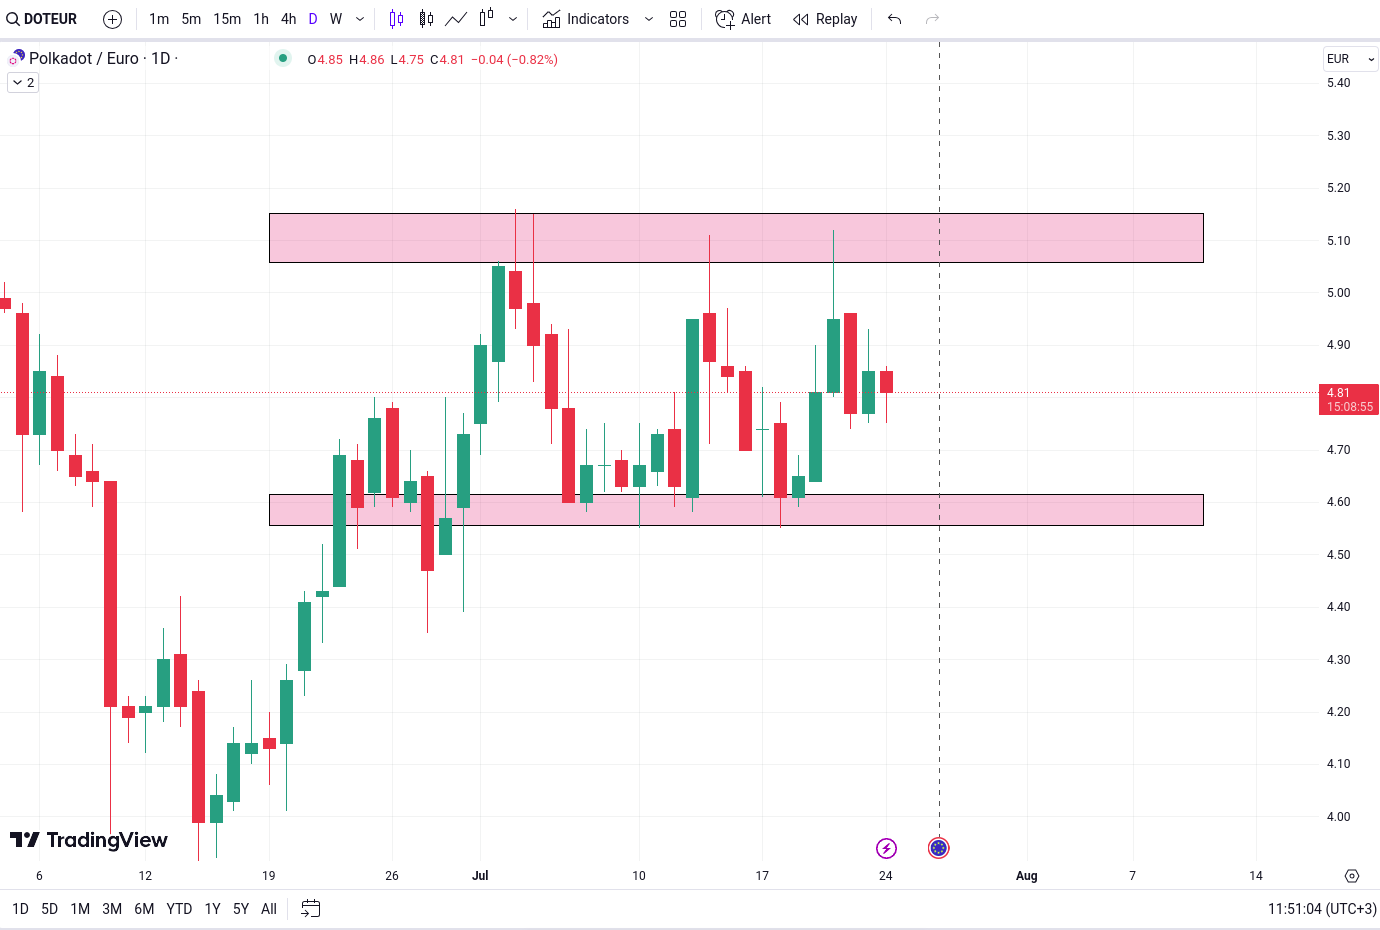
DOT analysis and update
DOT/EUR is currently undergoing consolidation within the demand and supply zones, creating an exciting trading environment. This period of indecision offers opportunities for both trend reversals and breakout or breakdown trades.
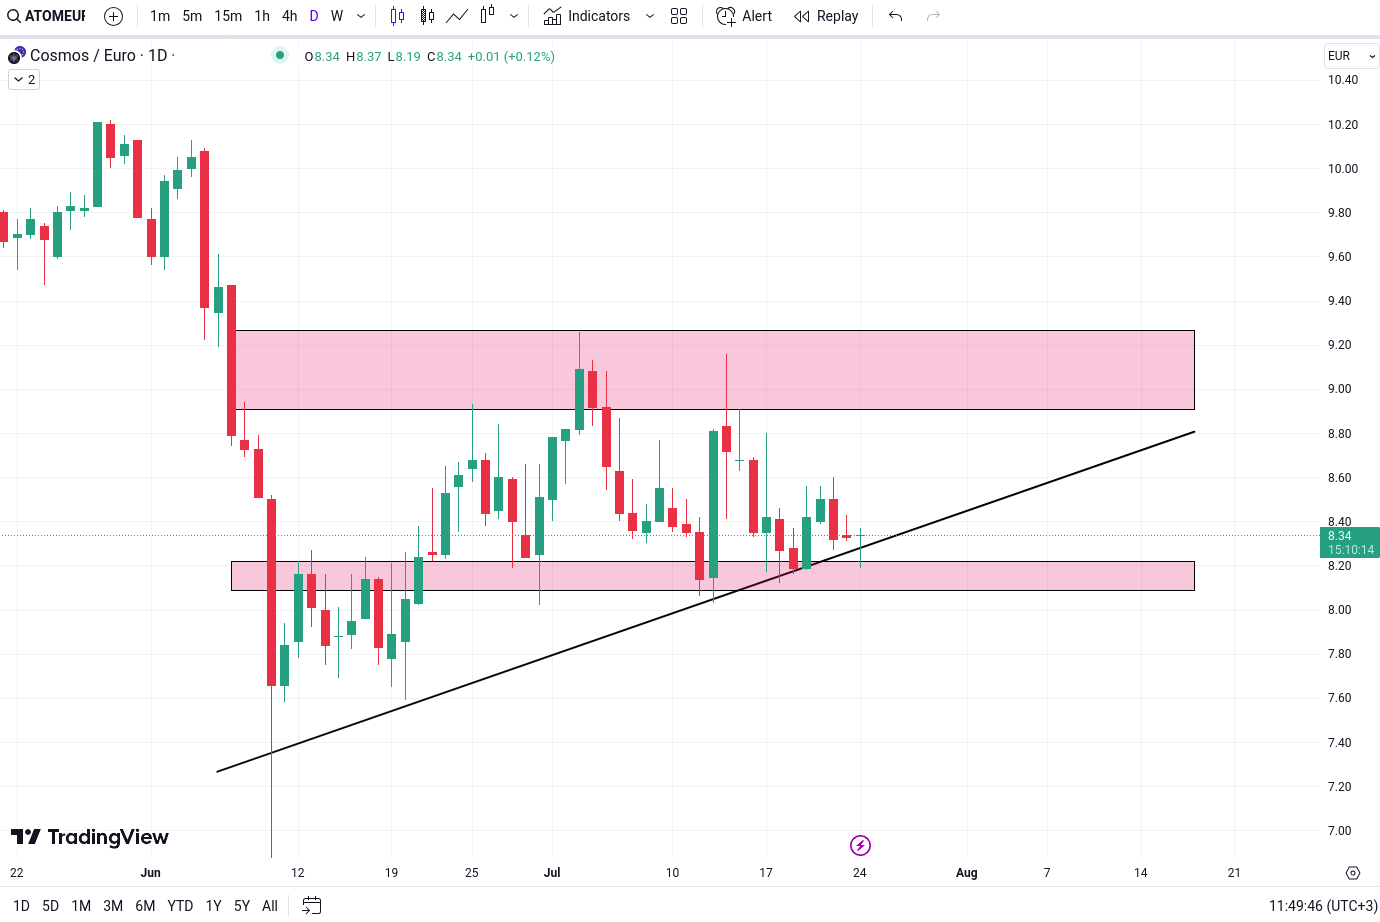
ATOM analysis and update
ATOM/EUR's price is currently situated below the demand and supply zones, while adhering to a bullish trendline. A conclusive breakdown that breaches both the trendline and demand zone could indicate a substantial bearish movement.
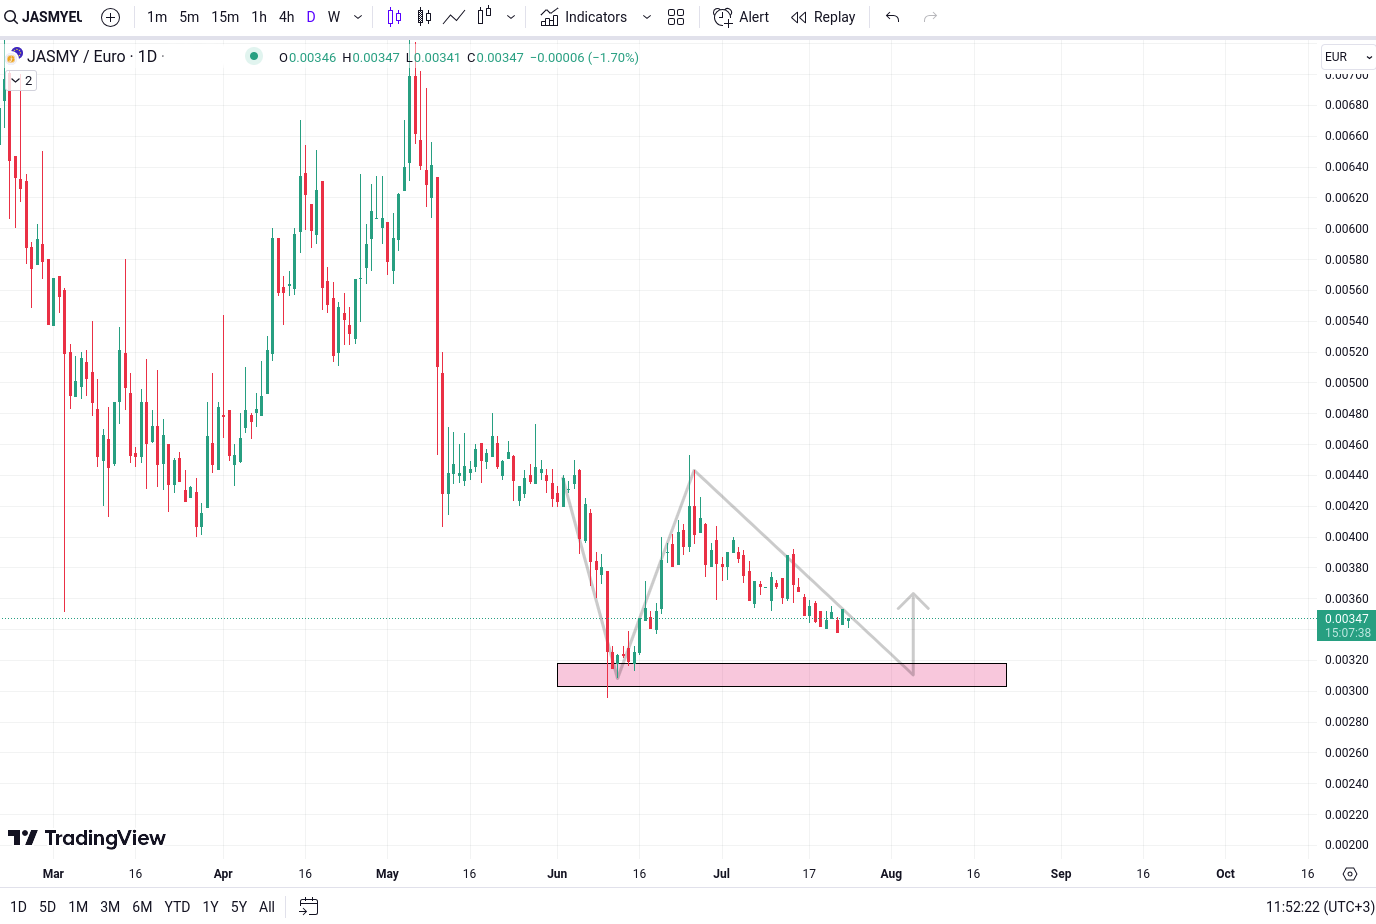
JASMYCoin (JASMY) analysis and update
JASMY/EUR The emergence of a Double bottom or W pattern near the support level could indicate a potential bullish trend reversal.
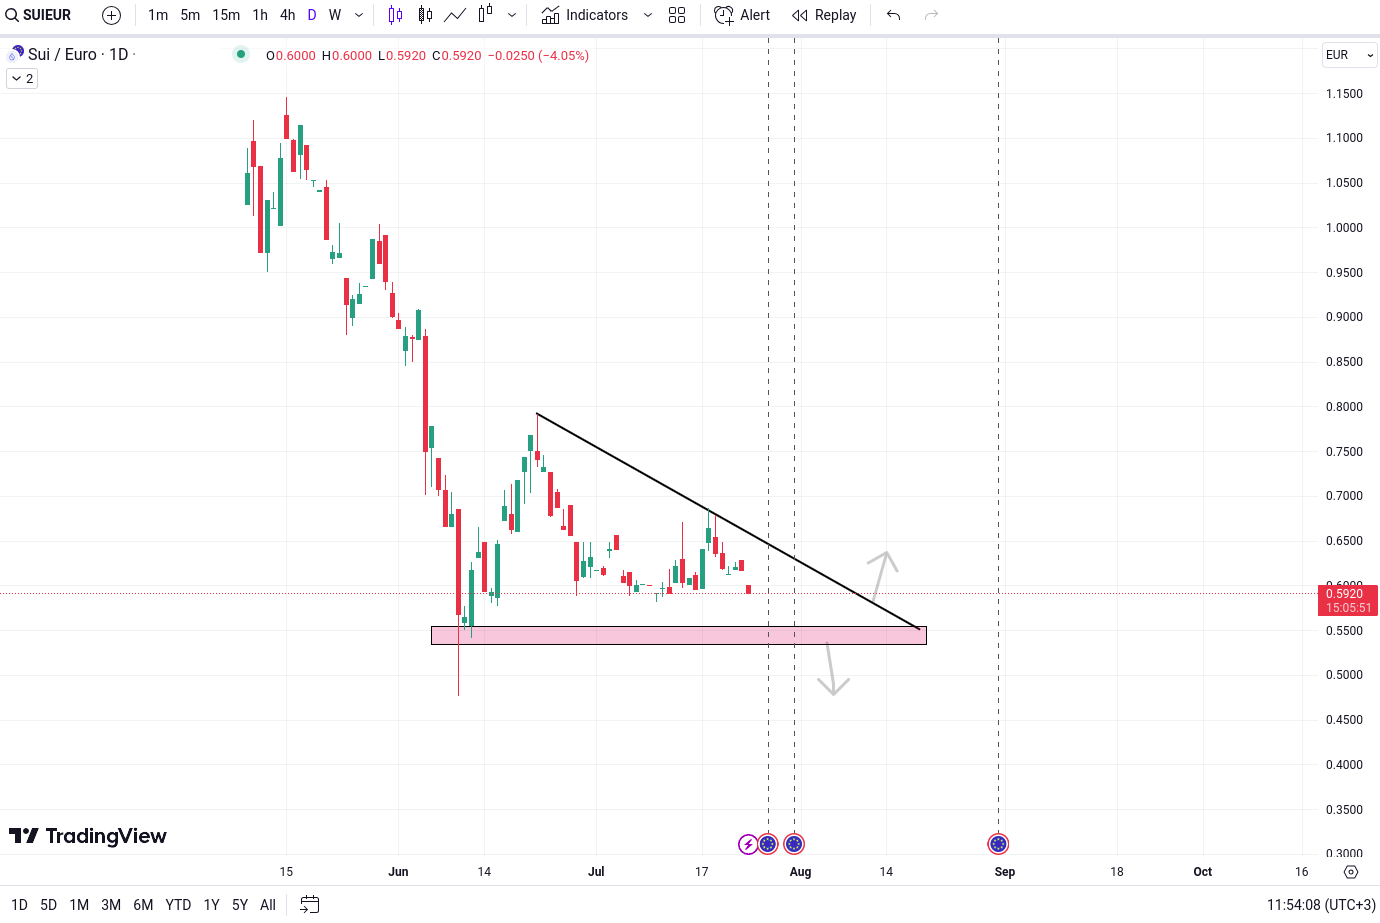
SUI analysis and update
SUI/EUR is currently in the process of forming a triangle pattern. A breakout above the upper trendline could signal a bullish trend, whereas a breakdown below the lower trendline might indicate a bearish sentiment.
SUI analysis and update
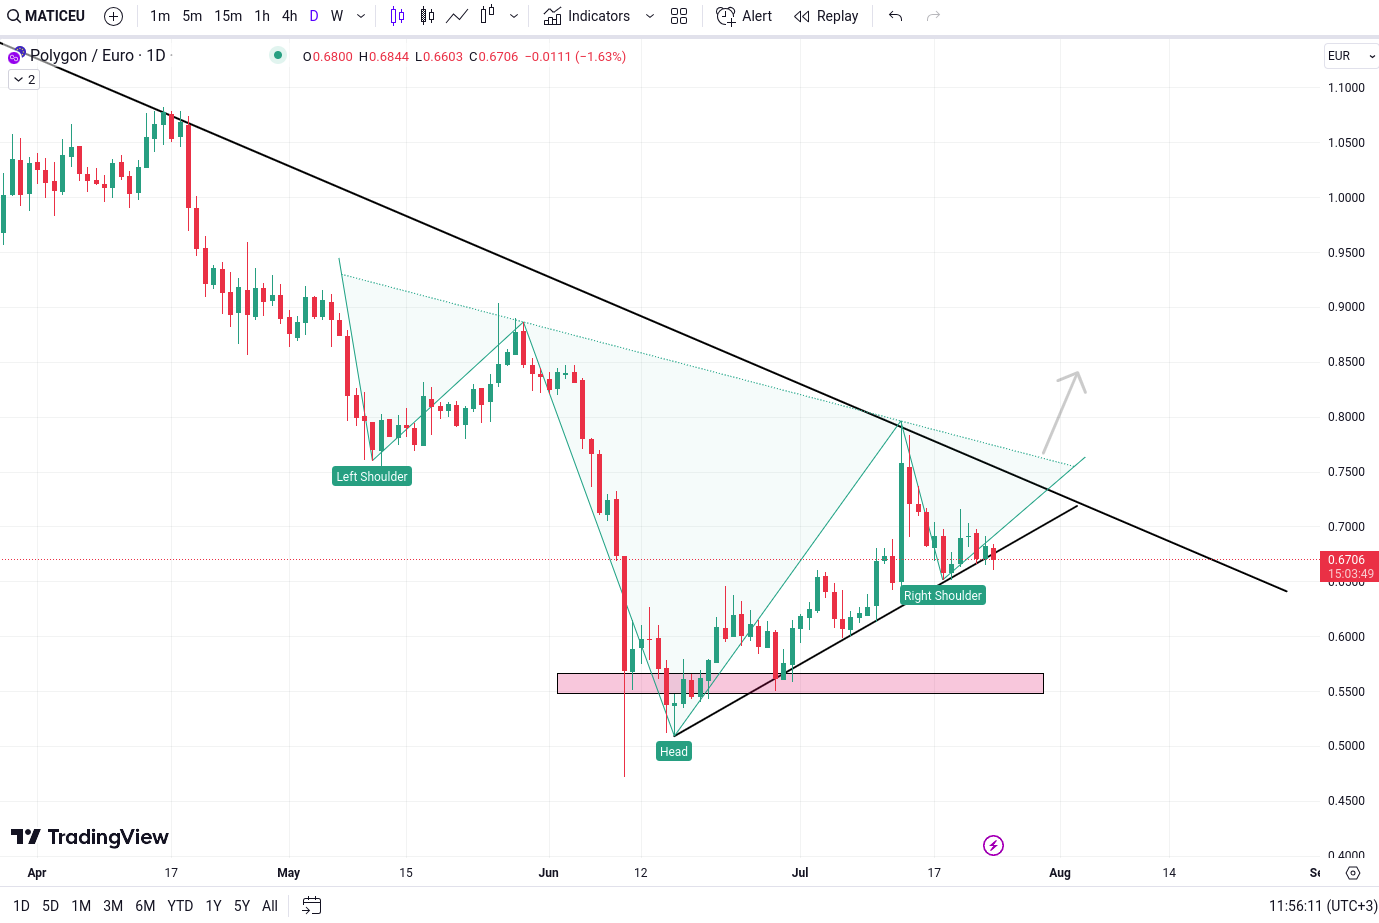
MATIC/EUR - If the asset finds support from the below trendline and breaks above the upper trendline, it has the potential to form an inverse head and shoulders pattern, indicating a bullish reversal.
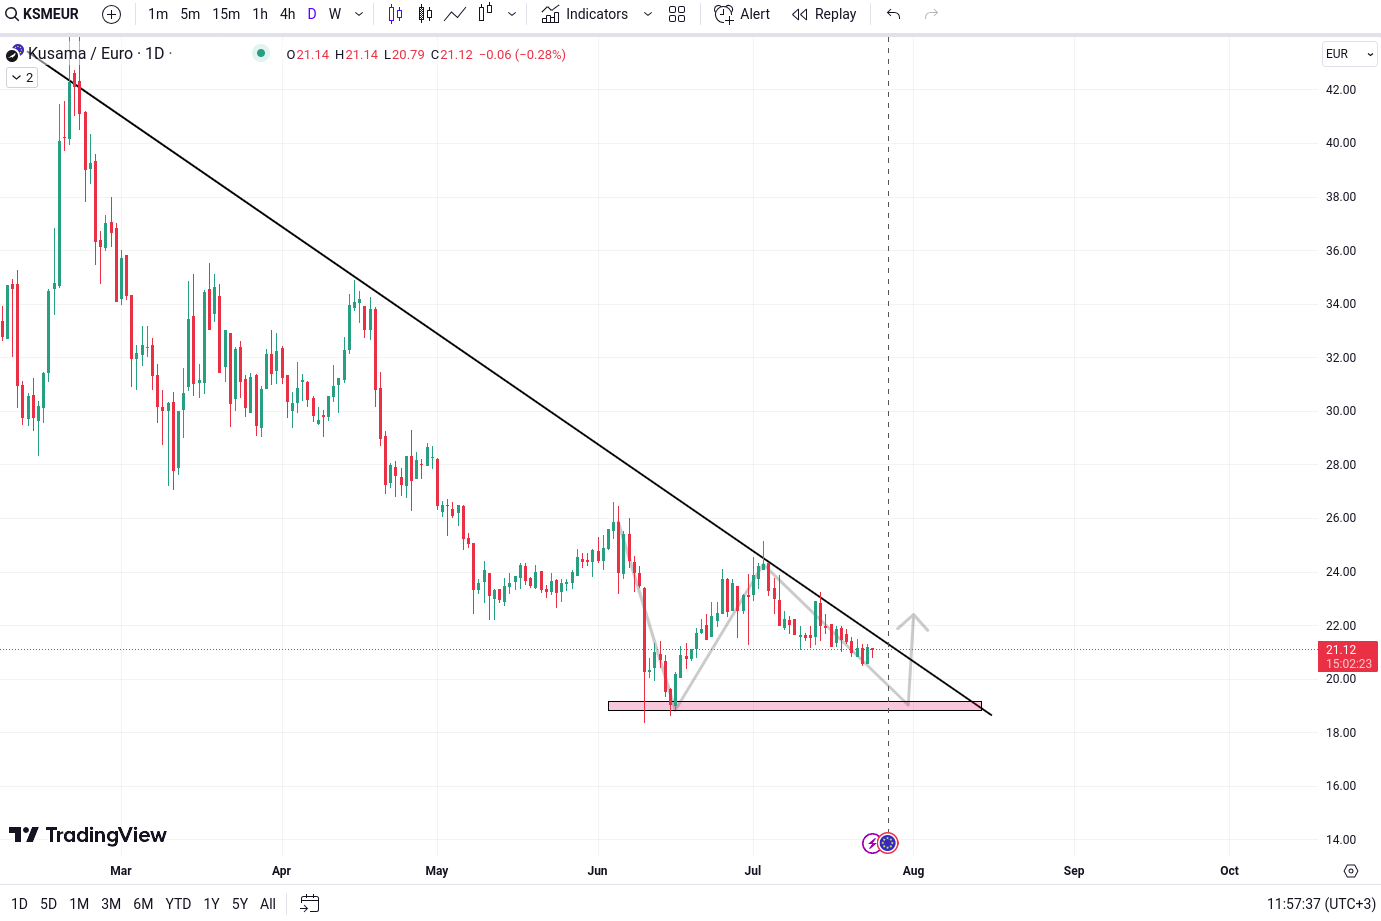
Kusama(KSM) analysis and update
KSM/EUR's price is exhibiting a similar price action to JASMY/EUR.
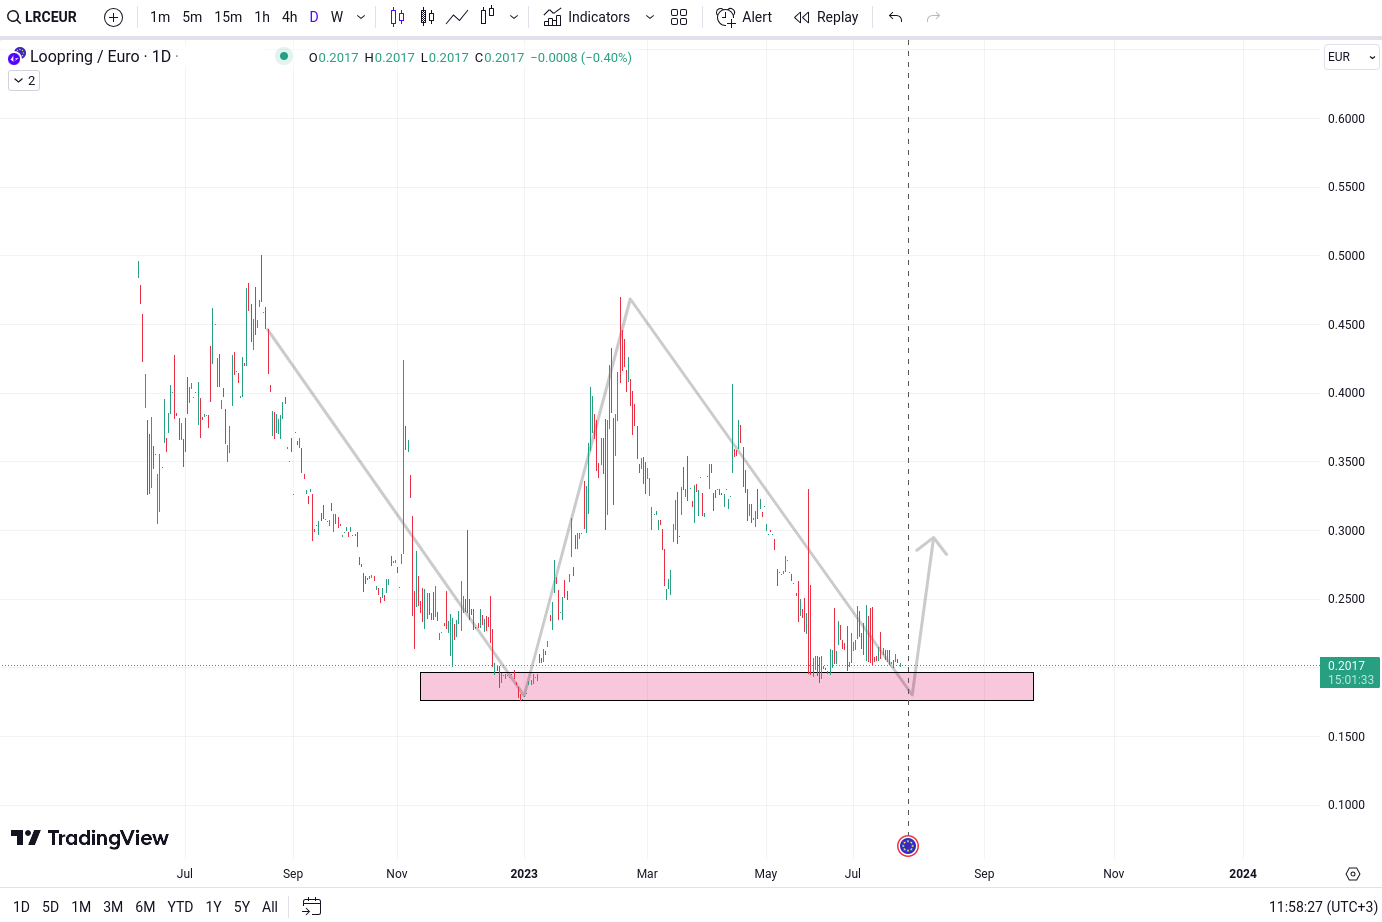
LRC analysis and update
LRC/EUR is also in close proximity to a crucial support zone.
All the analyzed cryptocurrencies are available for trading on the Tradesilvania platform, and their prices can be tracked on the Tradesilvania price page, accessible through the following link: https://tradesilvania.com/en/prices
With the help of the platform, you can deposit, withdraw, buy, or sell any of these cryptocurrencies using the free digital wallet.
Discover direct trading with fast SEPA on-ramp capabilities, 70 tokens available for SPOT trading and over 2000 cryptocurrencies available trough our OTC Desk.
Limitation of Liability
This report issued by Tradesilvania is purely informative and is not intended to be used as a tool for making investment decisions in crypto-assets. Any person who chooses to use this report in the process of making investment decisions assumes all related risks. Tradesilvania SRL has no legal or other obligation towards the person in question that would derive from the publication of this report publicly.
The content provided on the Tradesilvania website is for informational purposes only and should not be considered as investment advice, financial advice, trading advice, or any other form of advice. We do not endorse or recommend the buying, selling, or holding of any cryptocurrency. It is important that you conduct your own research and consult with a financial advisor before making any investment decisions. We cannot be held responsible for any investment choices made based on the information presented on our website.
The information in this report was obtained from public sources and is considered relevant and reliable within the limits of publicly available data. However, the value of the digital assets referred to in this report fluctuates over time, and past performance does not indicate future growth.
Total or partial reproduction of this report is permitted only by mentioning the source.